| Red | Green | Blue | |
| z | 17.64 | ||
| znorm | Inf | ||
| sky | -Inf | -Inf | -Inf |
| S/N | 19.8 | 33.3 | 37.0 |
| S/N(c) | 0.0 | 0.0 | 0.0 |
| SN(E/C) |

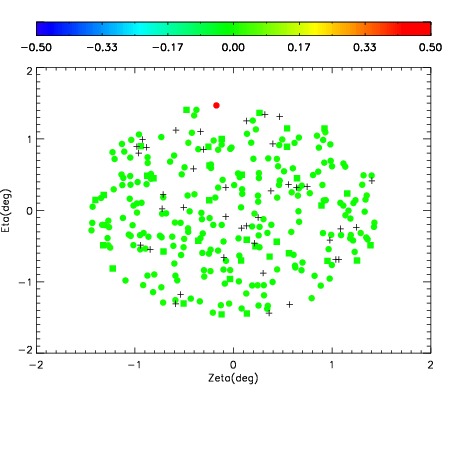

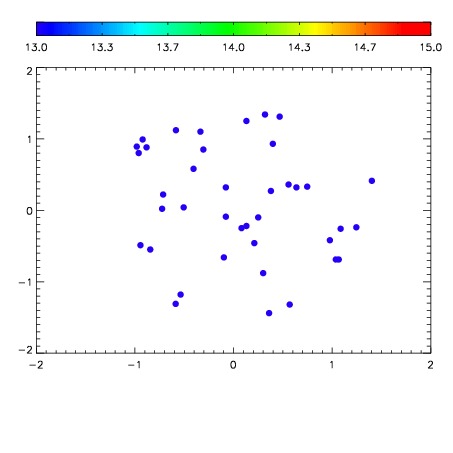

| Frame | Nreads | Zeropoints | Mag plots | Spatial mag deviation | Spatial sky 16325A emission deviations (filled: sky, open: star) | Spatial sky continuum emission | Spatial sky telluric CO2 absorption deviations (filled: H < 10) | |||||||||||||||||||||||
| 0 | 0 |
|
|
|
|
|
|
| IPAIR | NAME | SHIFT | NEWSHIFT | S/N | NAME | SHIFT | NEWSHIFT | S/N |
| 0 | 03100093 | 0.500751 | 0.00000 | 184.537 | 03100087 | 0.00000 | 0.500751 | 179.912 |
| 1 | 03100092 | 0.500319 | 0.000432014 | 200.116 | 03100094 | 0.00580923 | 0.494942 | 202.501 |
| 2 | 03100088 | 0.499452 | 0.00129902 | 167.389 | 03100091 | 0.00535414 | 0.495397 | 165.650 |
| 3 | 03100089 | 0.500393 | 0.000358045 | 141.241 | 03100090 | 0.00604385 | 0.494707 | 62.8363 |