| Red | Green | Blue | |
| z | 17.64 | ||
| znorm | Inf | ||
| sky | -Inf | -Inf | -Inf |
| S/N | 30.7 | 52.7 | 56.1 |
| S/N(c) | 0.0 | 0.0 | 0.0 |
| SN(E/C) |
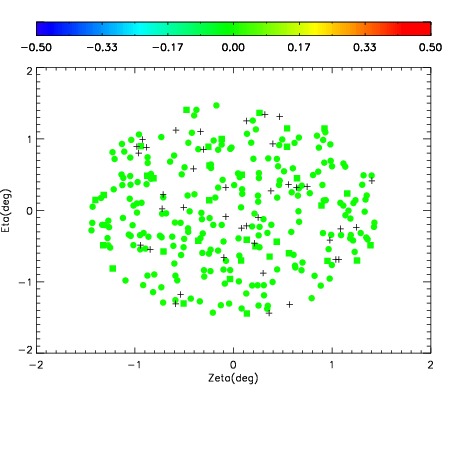
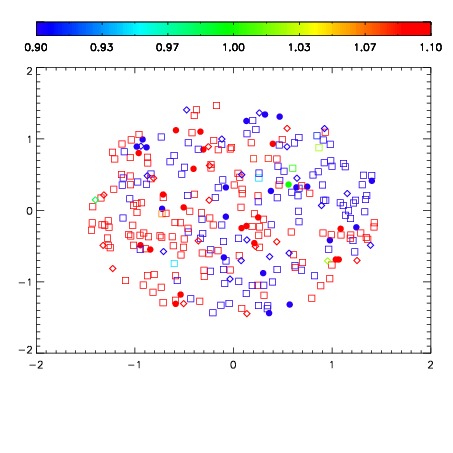
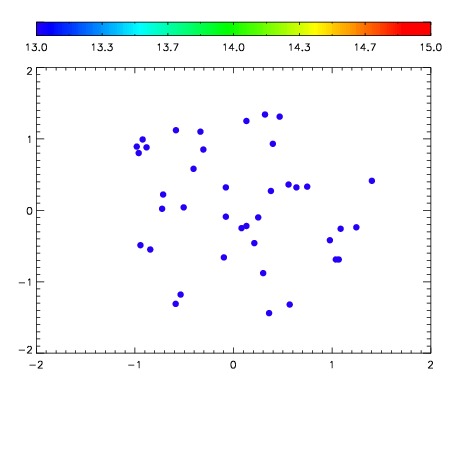

| Frame | Nreads | Zeropoints | Mag plots | Spatial mag deviation | Spatial sky 16325A emission deviations (filled: sky, open: star) | Spatial sky continuum emission | Spatial sky telluric CO2 absorption deviations (filled: H < 10) | |||||||||||||||||||||||
| 0 | 0 |
|
|
|
|
|
|
| IPAIR | NAME | SHIFT | NEWSHIFT | S/N | NAME | SHIFT | NEWSHIFT | S/N |
| 0 | 06950106 | 0.495920 | 0.00000 | 123.515 | 06950105 | -0.000832115 | 0.496752 | 119.659 |
| 1 | 06950099 | 0.494964 | 0.000955999 | 224.868 | 06950097 | 0.00000 | 0.495920 | 222.557 |
| 2 | 06950098 | 0.494564 | 0.00135601 | 222.962 | 06950100 | 0.00120406 | 0.494716 | 221.710 |
| 3 | 06950102 | 0.494659 | 0.00126100 | 221.796 | 06950101 | -0.00248766 | 0.498408 | 220.987 |
| 4 | 06950103 | 0.494871 | 0.00104901 | 191.865 | 06950104 | -0.000809831 | 0.496730 | 154.957 |