| Red | Green | Blue | |
| z | 17.64 | ||
| znorm | Inf | ||
| sky | -Inf | -Inf | -Inf |
| S/N | 25.3 | 45.8 | 50.4 |
| S/N(c) | 0.0 | 0.0 | 0.0 |
| SN(E/C) |
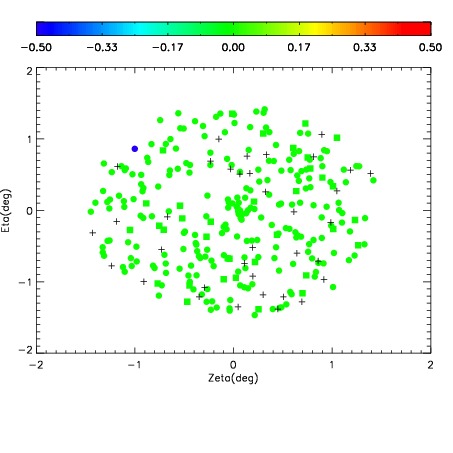
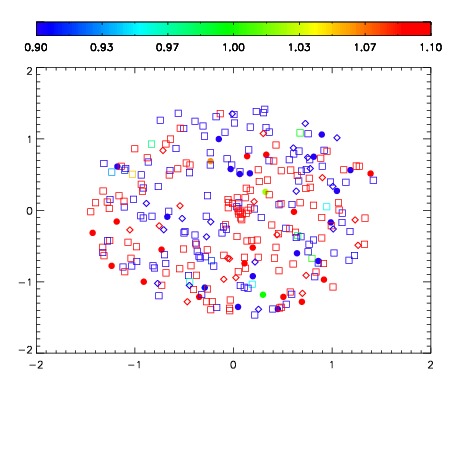
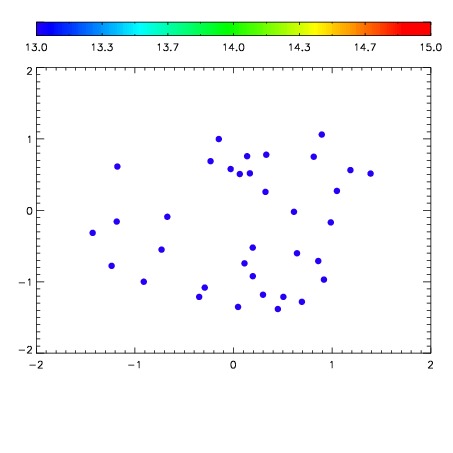

| Frame | Nreads | Zeropoints | Mag plots | Spatial mag deviation | Spatial sky 16325A emission deviations (filled: sky, open: star) | Spatial sky continuum emission | Spatial sky telluric CO2 absorption deviations (filled: H < 10) | |||||||||||||||||||||||
| 0 | 0 |
|
|
|
|
|
|
| IPAIR | NAME | SHIFT | NEWSHIFT | S/N | NAME | SHIFT | NEWSHIFT | S/N |
| 0 | 03700077 | 0.509621 | 0.00000 | 238.196 | 03700074 | -0.000960827 | 0.510582 | 233.028 |
| 1 | 03700072 | 0.499099 | 0.0105220 | 238.751 | 03700071 | 0.00000 | 0.509621 | 233.857 |
| 2 | 03700076 | 0.502422 | 0.00719905 | 237.373 | 03700075 | -0.000479612 | 0.510101 | 232.687 |
| 3 | 03700073 | 0.500389 | 0.00923204 | 236.282 | 03700078 | 0.000596327 | 0.509025 | 232.233 |