| Red | Green | Blue | |
| z | 17.64 | ||
| znorm | Inf | ||
| sky | -Inf | -Inf | -Inf |
| S/N | 24.7 | 40.9 | 50.5 |
| S/N(c) | 0.0 | 0.0 | 0.0 |
| SN(E/C) |
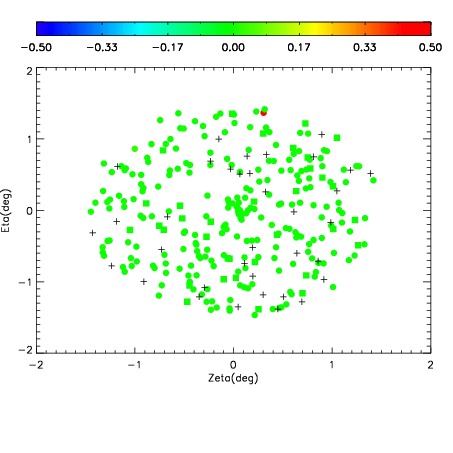
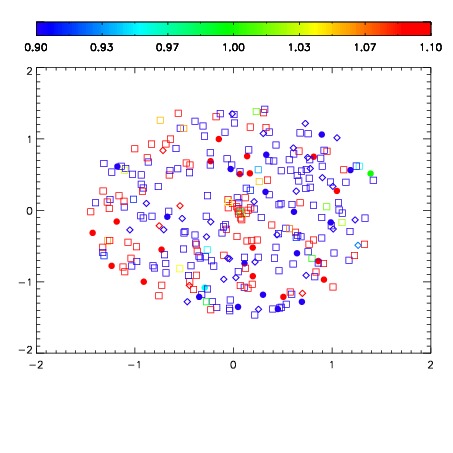


| Frame | Nreads | Zeropoints | Mag plots | Spatial mag deviation | Spatial sky 16325A emission deviations (filled: sky, open: star) | Spatial sky continuum emission | Spatial sky telluric CO2 absorption deviations (filled: H < 10) | |||||||||||||||||||||||
| 0 | 0 |
|
|
|
|
|
|
| IPAIR | NAME | SHIFT | NEWSHIFT | S/N | NAME | SHIFT | NEWSHIFT | S/N |
| 0 | 04030053 | 0.502250 | 0.00000 | 244.815 | 04030051 | 0.00000 | 0.502250 | 249.567 |
| 1 | 04030052 | 0.500911 | 0.00133902 | 244.560 | 04030054 | 0.00258692 | 0.499663 | 246.163 |
| 2 | 04030056 | 0.501640 | 0.000609994 | 214.719 | 04030055 | 0.000572040 | 0.501678 | 237.897 |
| 3 | 04030057 | 0.501802 | 0.000447989 | 211.223 | 04030058 | 0.000865492 | 0.501384 | 182.514 |