| Red | Green | Blue | |
| z | 17.64 | ||
| znorm | Inf | ||
| sky | -Inf | -NaN | -Inf |
| S/N | 15.3 | 27.4 | 31.5 |
| S/N(c) | 0.0 | 0.0 | 0.0 |
| SN(E/C) |

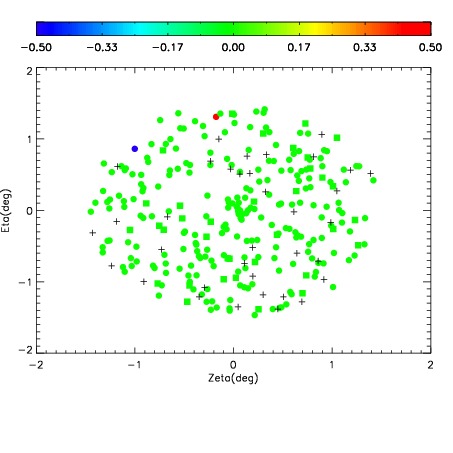
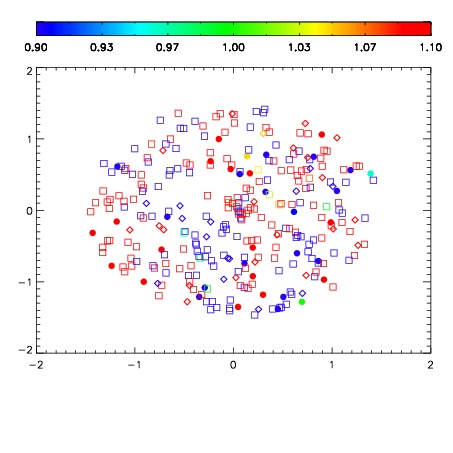


| Frame | Nreads | Zeropoints | Mag plots | Spatial mag deviation | Spatial sky 16325A emission deviations (filled: sky, open: star) | Spatial sky continuum emission | Spatial sky telluric CO2 absorption deviations (filled: H < 10) | |||||||||||||||||||||||
| 0 | 0 |
|
|
|
|
|
|
| IPAIR | NAME | SHIFT | NEWSHIFT | S/N | NAME | SHIFT | NEWSHIFT | S/N |
| 0 | 04600016 | 0.501859 | 0.00000 | 179.182 | 04600017 | 0.00241499 | 0.499444 | 195.718 |
| 1 | 04600011 | 0.500428 | 0.00143099 | 170.806 | 04600010 | 0.00000 | 0.501859 | 175.575 |
| 2 | 04600015 | 0.499790 | 0.00206900 | 170.514 | 04600013 | 0.00134040 | 0.500519 | 168.548 |
| 3 | 04600012 | 0.501359 | 0.000500023 | 164.344 | 04600014 | 0.00163012 | 0.500229 | 157.033 |