| Red | Green | Blue | |
| z | 17.64 | ||
| znorm | Inf | ||
| sky | -Inf | -Inf | -Inf |
| S/N | 16.5 | 32.5 | 34.5 |
| S/N(c) | 0.0 | 0.0 | 0.0 |
| SN(E/C) |

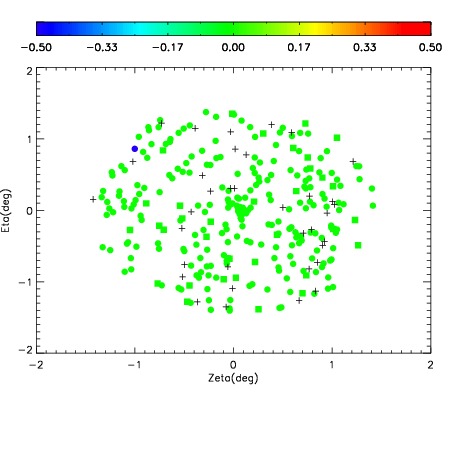
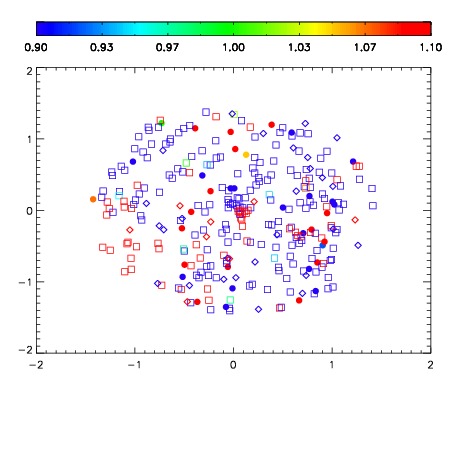
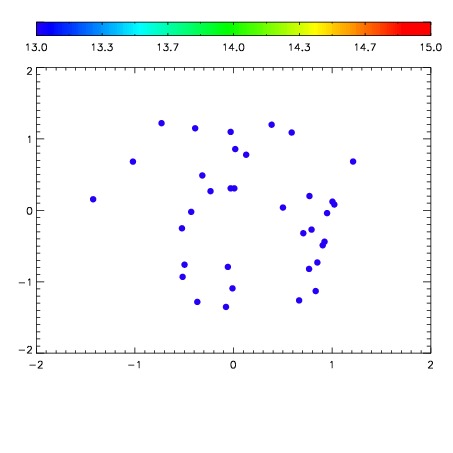

| Frame | Nreads | Zeropoints | Mag plots | Spatial mag deviation | Spatial sky 16325A emission deviations (filled: sky, open: star) | Spatial sky continuum emission | Spatial sky telluric CO2 absorption deviations (filled: H < 10) | |||||||||||||||||||||||
| 0 | 0 |
|
|
|
|
|
|
| IPAIR | NAME | SHIFT | NEWSHIFT | S/N | NAME | SHIFT | NEWSHIFT | S/N |
| 0 | 04070012 | 0.503741 | 0.00000 | 193.011 | 04070018 | 0.00242646 | 0.501315 | 155.891 |
| 1 | 04070020 | 0.501603 | 0.00213802 | 212.842 | 04070021 | 0.00422101 | 0.499520 | 227.123 |
| 2 | 04070019 | 0.502596 | 0.00114501 | 170.460 | 04070014 | 0.00353638 | 0.500205 | 134.244 |
| 3 | 04070016 | 0.502869 | 0.000872016 | 167.064 | 04070013 | 0.00409564 | 0.499645 | 127.730 |
| 4 | 04070011 | 0.502774 | 0.000967026 | 162.731 | 04070017 | 0.00514400 | 0.498597 | 120.035 |
| 5 | 04070015 | 0.502573 | 0.00116801 | 141.336 | 04070010 | 0.00000 | 0.503741 | 105.260 |