| Red | Green | Blue | |
| z | 17.64 | ||
| znorm | Inf | ||
| sky | -Inf | -Inf | -Inf |
| S/N | 33.6 | 57.5 | 64.9 |
| S/N(c) | 0.0 | 0.0 | 0.0 |
| SN(E/C) |
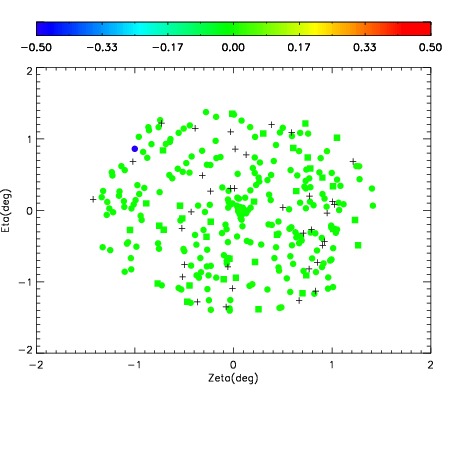
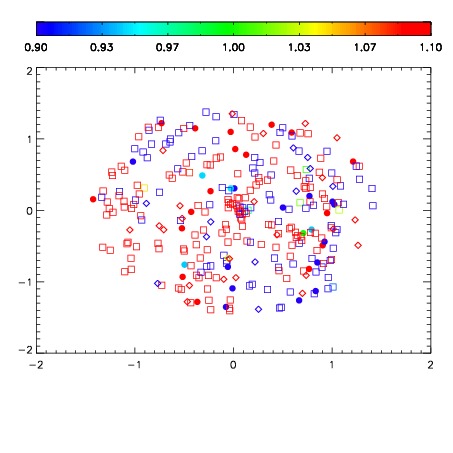


| Frame | Nreads | Zeropoints | Mag plots | Spatial mag deviation | Spatial sky 16325A emission deviations (filled: sky, open: star) | Spatial sky continuum emission | Spatial sky telluric CO2 absorption deviations (filled: H < 10) | |||||||||||||||||||||||
| 0 | 0 |
|
|
|
|
|
|
| IPAIR | NAME | SHIFT | NEWSHIFT | S/N | NAME | SHIFT | NEWSHIFT | S/N |
| 0 | 06940099 | 0.500523 | 0.00000 | 254.866 | 06940101 | 0.00435196 | 0.496171 | 252.194 |
| 1 | 06940107 | 0.497285 | 0.00323796 | 257.513 | 06940106 | -0.000403533 | 0.500926 | 257.095 |
| 2 | 06940108 | 0.497623 | 0.00289997 | 257.499 | 06940105 | 0.000659734 | 0.499863 | 256.977 |
| 3 | 06940103 | 0.497815 | 0.00270796 | 255.440 | 06940109 | 0.00254147 | 0.497981 | 256.867 |
| 4 | 06940104 | 0.497893 | 0.00262997 | 255.288 | 06940098 | 0.00000 | 0.500523 | 256.480 |
| 5 | 06940100 | 0.500367 | 0.000155985 | 254.873 | 06940102 | 0.000942438 | 0.499581 | 253.998 |