| Frame | Nreads | Zeropoints | Mag plots
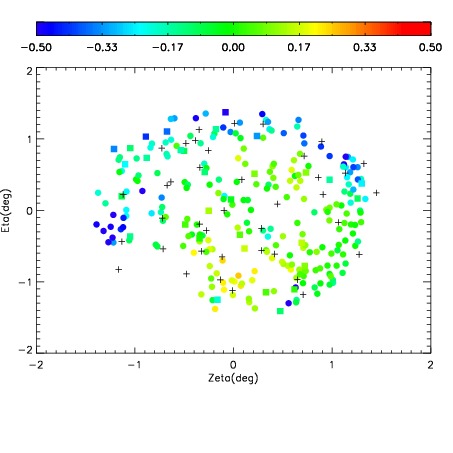
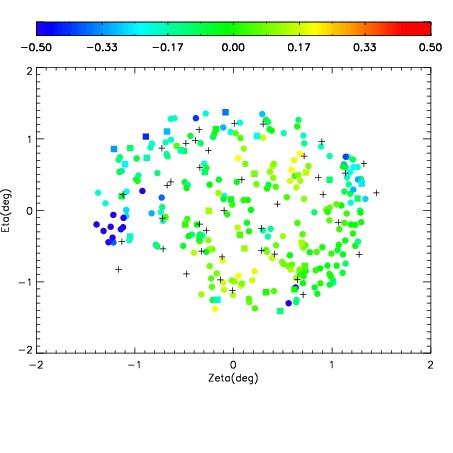
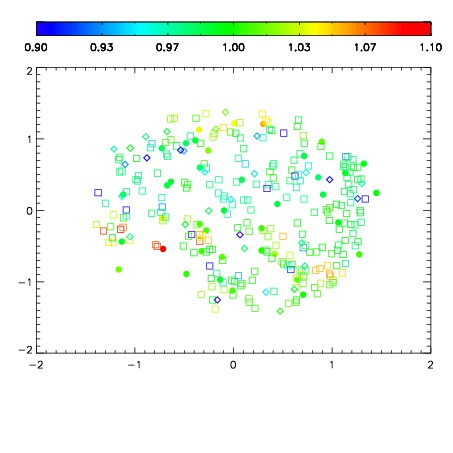
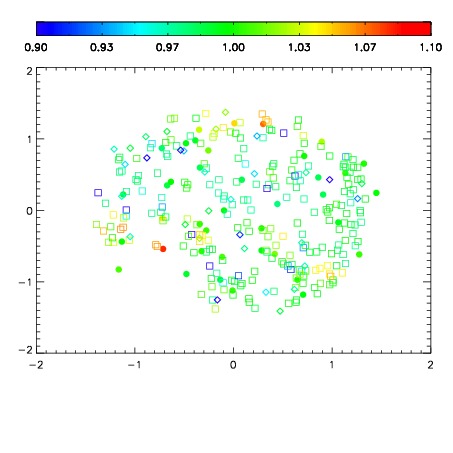
| Spatial mag deviation
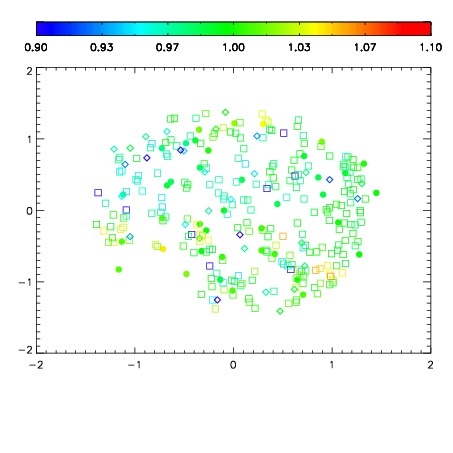
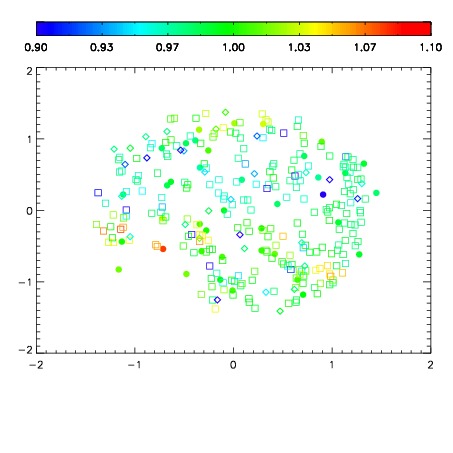
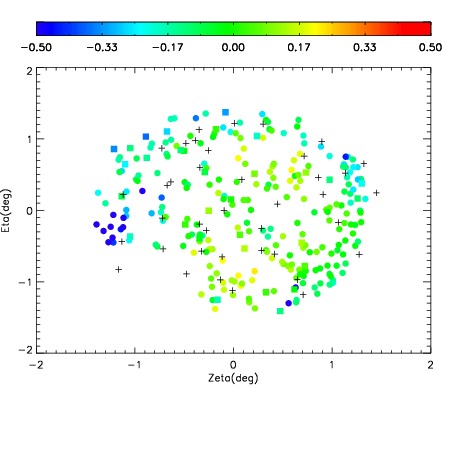
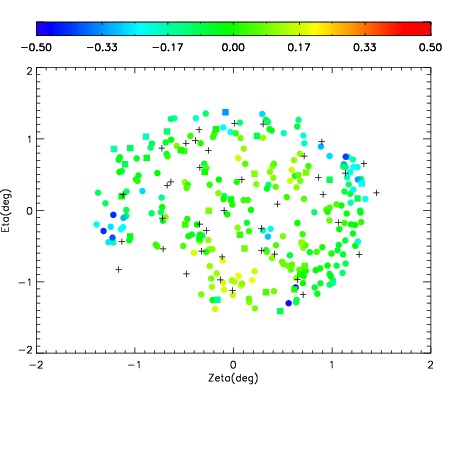
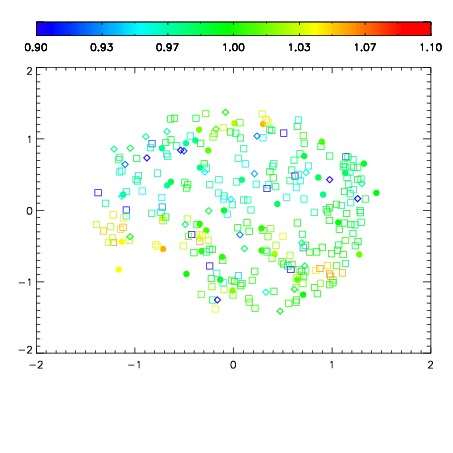
| Spatial sky 16325A emission deviations (filled: sky, open: star)
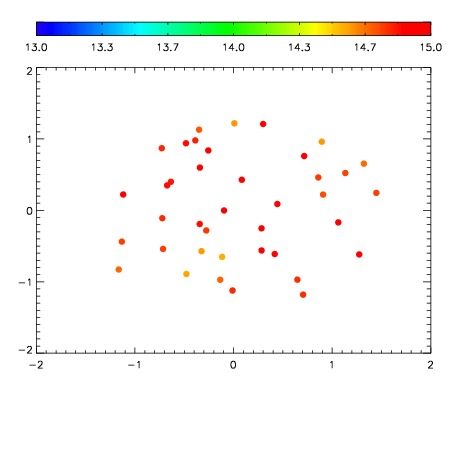
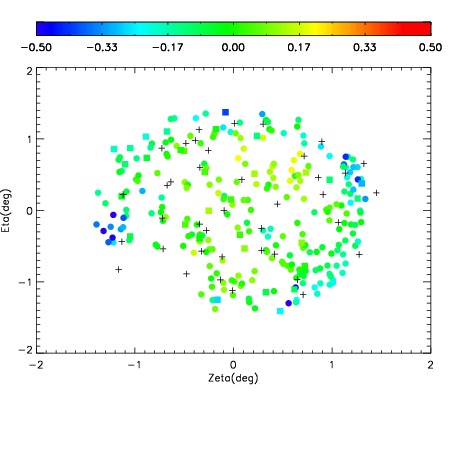
| Spatial sky continuum emission
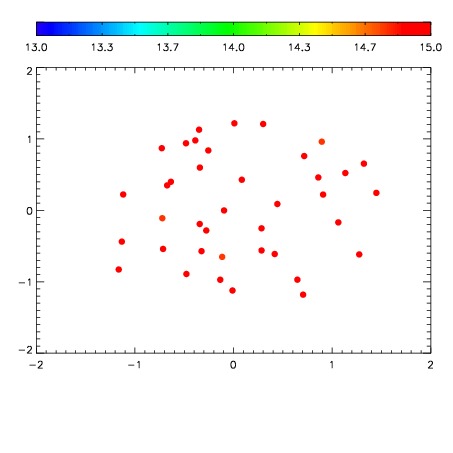
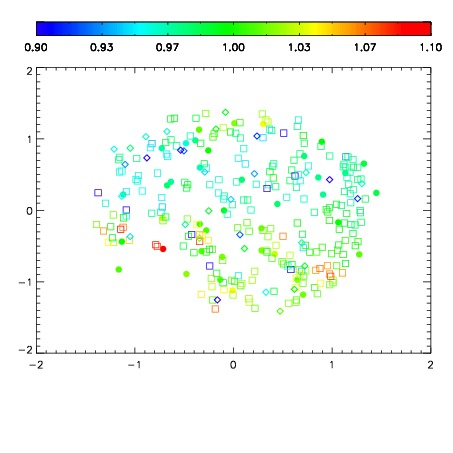
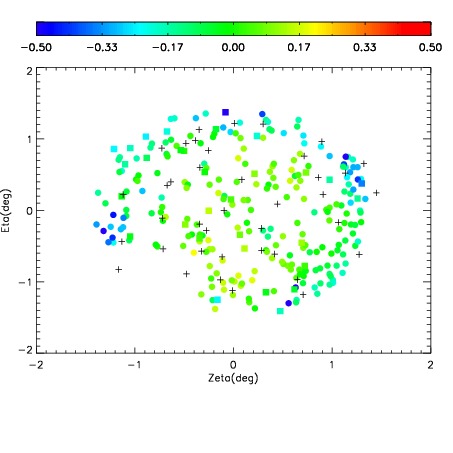
| Spatial sky telluric CO2 absorption deviations (filled: H < 10)
|
| 3960054
| 47
| | Red | Green | Blue
| | z | | 18.42
| | znorm | | 14.24
| | sky | 15.3 | 14.8 | 14.9
| | S/N | 10.1 | 17.9 | 20.4
| | S/N(c) | 8.6 | 16.9 | 19.3
| | SN(E/C) 0.49
|
| 
| 
| 
| 
| 
|
| 3960055
| 47
| | Red | Green | Blue
| | z | | 18.46
| | znorm | | 14.28
| | sky | 15.2 | 15.0 | 15.7
| | S/N | 10.0 | 18.3 | 21.1
| | S/N(c) | 8.7 | 17.1 | 19.9
| | SN(E/C) 0.51
|
| 
| 
| 
| 
| 
|
| 3960056
| 47
| | Red | Green | Blue
| | z | | 18.54
| | znorm | | 14.36
| | sky | 15.3 | 15.0 | 15.8
| | S/N | 10.6 | 19.2 | 21.5
| | S/N(c) | 9.1 | 17.8 | 20.5
| | SN(E/C) 0.45
|
| 
| 
| 
| 
| 
|
| 3960057
| 47
| | Red | Green | Blue
| | z | | 18.51
| | znorm | | 14.33
| | sky | 15.6 | 15.2 | 15.7
| | S/N | 10.6 | 18.9 | 20.9
| | S/N(c) | 9.2 | 17.5 | 20.0
| | SN(E/C) 0.47
|
| 
| 
| 
| 
| 
|
| 3960058
| 47
| | Red | Green | Blue
| | z | | 18.21
| | znorm | | 14.03
| | sky | 15.6 | 15.5 | 15.6
| | S/N | 8.4 | 16.0 | 17.7
| | S/N(c) | 7.2 | 14.7 | 16.3
| | SN(E/C) 0.50
|
| 
| 
| 
| 
| 
|
| 3960059
| 47
| | Red | Green | Blue
| | z | | 18.52
| | znorm | | 14.34
| | sky | 15.5 | 15.4 | 15.5
| | S/N | 10.4 | 18.6 | 20.8
| | S/N(c) | 9.2 | 17.4 | 19.6
| | SN(E/C) 0.46
|
| 
| 
| 
| 
| 
|
| 3960060
| 47
| | Red | Green | Blue
| | z | | 18.57
| | znorm | | 14.39
| | sky | 15.3 | 15.3 | 15.4
| | S/N | 10.4 | 19.4 | 21.0
| | S/N(c) | 9.1 | 18.1 | 20.0
| | SN(E/C) 0.47
|
| 
| 
| 
| 
| 
|
| 3960061
| 47
| | Red | Green | Blue
| | z | | 18.63
| | znorm | | 14.45
| | sky | 15.2 | 15.2 | 15.5
| | S/N | 11.4 | 20.4 | 21.7
| | S/N(c) | 9.9 | 18.9 | 20.7
| | SN(E/C) 0.43
|
| 
| 
| 
| 
| 
|

