| Red | Green | Blue | |
| z | 17.64 | ||
| znorm | Inf | ||
| sky | -NaN | -Inf | -Inf |
| S/N | 17.7 | 34.7 | 39.8 |
| S/N(c) | 0.0 | 0.0 | 0.0 |
| SN(E/C) |
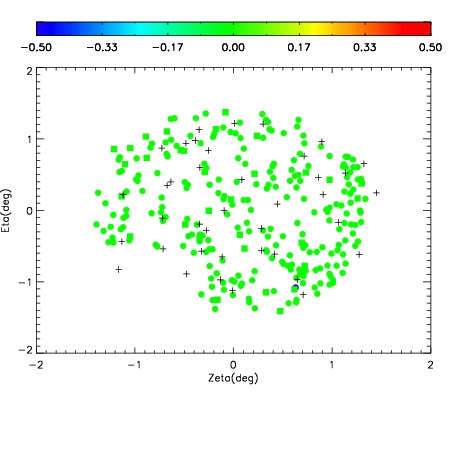
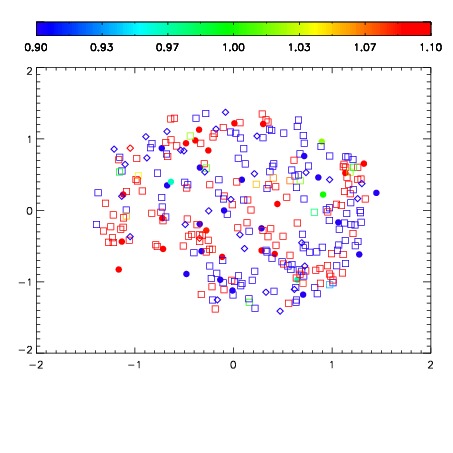
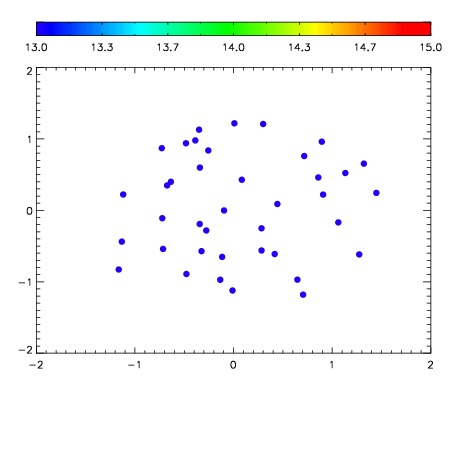

| Frame | Nreads | Zeropoints | Mag plots | Spatial mag deviation | Spatial sky 16325A emission deviations (filled: sky, open: star) | Spatial sky continuum emission | Spatial sky telluric CO2 absorption deviations (filled: H < 10) | |||||||||||||||||||||||
| 0 | 0 |
|
|
|
|
|
|
| IPAIR | NAME | SHIFT | NEWSHIFT | S/N | NAME | SHIFT | NEWSHIFT | S/N |
| 0 | 03960060 | 0.502634 | 0.00000 | 159.911 | 03960054 | 0.00000 | 0.502634 | 140.220 |
| 1 | 03960056 | 0.498321 | 0.00431299 | 162.821 | 03960061 | 0.00429202 | 0.498342 | 179.066 |
| 2 | 03960059 | 0.501957 | 0.000676990 | 161.105 | 03960057 | -0.00119708 | 0.503831 | 159.911 |
| 3 | 03960055 | 0.498272 | 0.00436199 | 157.817 | 03960058 | -0.00112330 | 0.503757 | 138.726 |