| Red | Green | Blue | |
| z | 17.64 | ||
| znorm | Inf | ||
| sky | -Inf | -Inf | -Inf |
| S/N | 24.6 | 44.6 | 52.2 |
| S/N(c) | 0.0 | 0.0 | 0.0 |
| SN(E/C) |
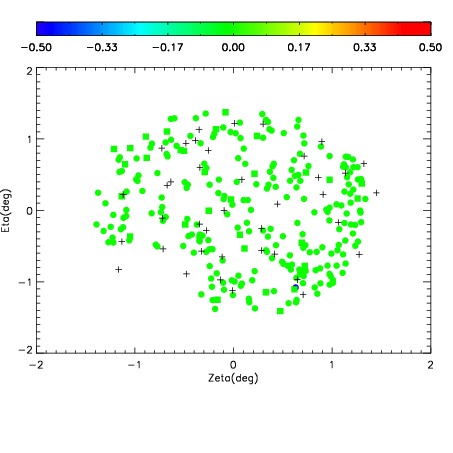
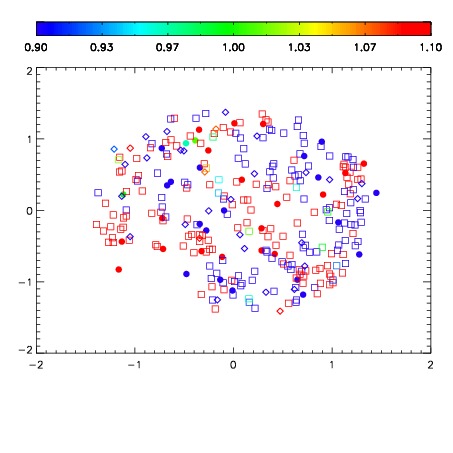
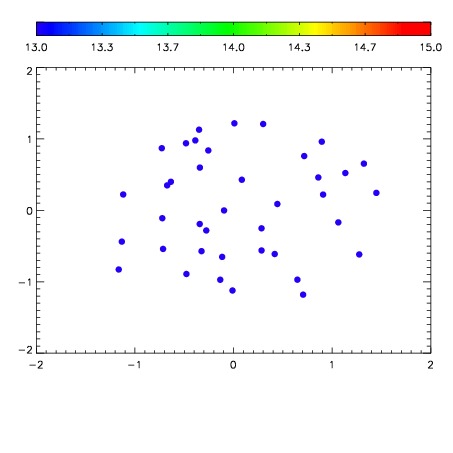

| Frame | Nreads | Zeropoints | Mag plots | Spatial mag deviation | Spatial sky 16325A emission deviations (filled: sky, open: star) | Spatial sky continuum emission | Spatial sky telluric CO2 absorption deviations (filled: H < 10) | |||||||||||||||||||||||
| 0 | 0 |
|
|
|
|
|
|
| IPAIR | NAME | SHIFT | NEWSHIFT | S/N | NAME | SHIFT | NEWSHIFT | S/N |
| 0 | 03970066 | 0.500144 | 0.00000 | 196.852 | 03970067 | 0.000511689 | 0.499632 | 197.837 |
| 1 | 03970065 | 0.499901 | 0.000243008 | 186.515 | 03970064 | 0.00188404 | 0.498260 | 196.955 |
| 2 | 03970062 | 0.497069 | 0.00307500 | 184.259 | 03970063 | 0.00127785 | 0.498866 | 190.303 |
| 3 | 03970061 | 0.495982 | 0.00416201 | 177.664 | 03970060 | 0.00000 | 0.500144 | 176.606 |