| Red | Green | Blue | |
| z | 17.64 | ||
| znorm | Inf | ||
| sky | -Inf | -Inf | -Inf |
| S/N | 22.5 | 41.2 | 46.2 |
| S/N(c) | 0.0 | 0.0 | 0.0 |
| SN(E/C) |
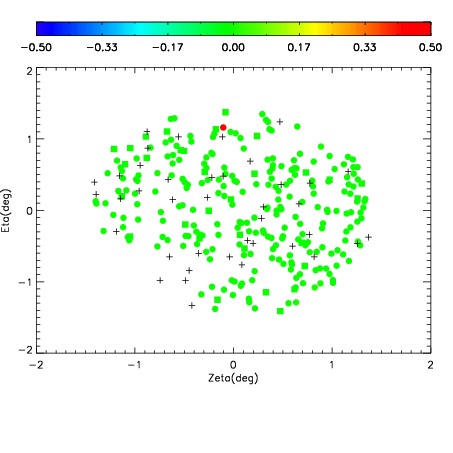
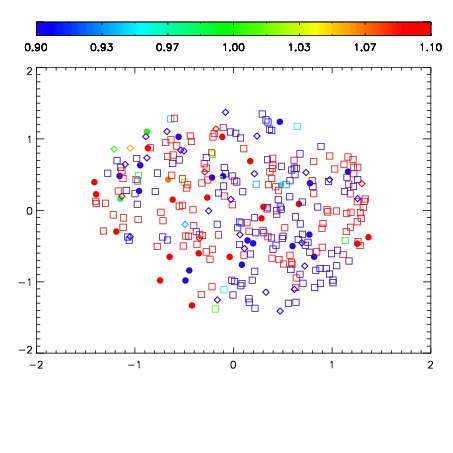
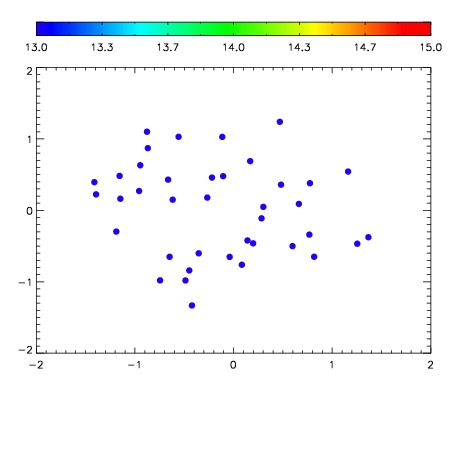

| Frame | Nreads | Zeropoints | Mag plots | Spatial mag deviation | Spatial sky 16325A emission deviations (filled: sky, open: star) | Spatial sky continuum emission | Spatial sky telluric CO2 absorption deviations (filled: H < 10) | |||||||||||||||||||||||
| 0 | 0 |
|
|
|
|
|
|
| IPAIR | NAME | SHIFT | NEWSHIFT | S/N | NAME | SHIFT | NEWSHIFT | S/N |
| 0 | 03740040 | 0.502282 | 0.00000 | 215.931 | 03740041 | 0.00475536 | 0.497527 | 206.267 |
| 1 | 03740039 | 0.500226 | 0.00205600 | 212.718 | 03740038 | 0.00294776 | 0.499334 | 205.280 |
| 2 | 03740036 | 0.498961 | 0.00332102 | 187.622 | 03740037 | 0.00260056 | 0.499681 | 203.251 |
| 3 | 03740035 | 0.497309 | 0.00497302 | 177.220 | 03740034 | 0.00000 | 0.502282 | 171.390 |