| Red | Green | Blue | |
| z | 17.65 | ||
| znorm | Inf | ||
| sky | -Inf | -Inf | -Inf |
| S/N | 5.3 | 10.0 | 11.2 |
| S/N(c) | 0.0 | 0.0 | 0.0 |
| SN(E/C) |

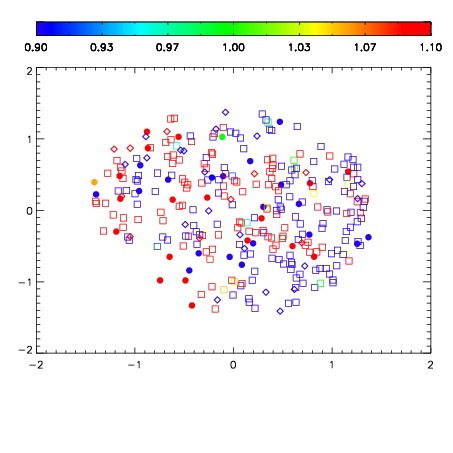
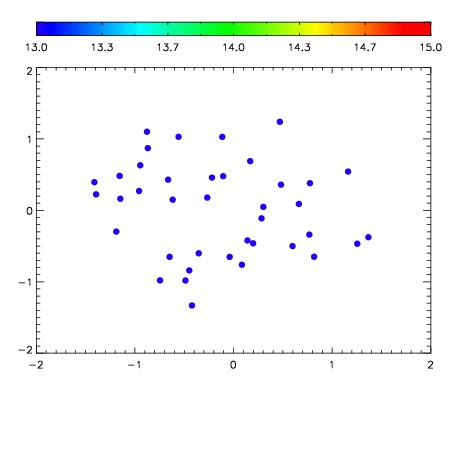

| Frame | Nreads | Zeropoints | Mag plots | Spatial mag deviation | Spatial sky 16325A emission deviations (filled: sky, open: star) | Spatial sky continuum emission | Spatial sky telluric CO2 absorption deviations (filled: H < 10) | |||||||||||||||||||||||
| 0 | 0 |
|
|
|
|
|
|
| IPAIR | NAME | SHIFT | NEWSHIFT | S/N | NAME | SHIFT | NEWSHIFT | S/N |
| 0 | 04020026 | 0.503186 | 0.00000 | 74.0566 | 04020028 | 0.00140694 | 0.501779 | 101.732 |
| 1 | 04020025 | 0.499682 | 0.00350398 | 90.8254 | 04020024 | 0.00000 | 0.503186 | 122.440 |
| 2 | 04020029 | 0.501201 | 0.00198501 | 88.6851 | 04020027 | 0.00221264 | 0.500973 | 115.319 |
| 3 | 04020030 | 0.502604 | 0.000581980 | 43.6368 | 04020031 | 0.00288980 | 0.500296 | 49.5778 |