| Red | Green | Blue | |
| z | 17.64 | ||
| znorm | Inf | ||
| sky | -Inf | -Inf | -Inf |
| S/N | 34.3 | 62.2 | 68.8 |
| S/N(c) | 0.0 | 0.0 | 0.0 |
| SN(E/C) |
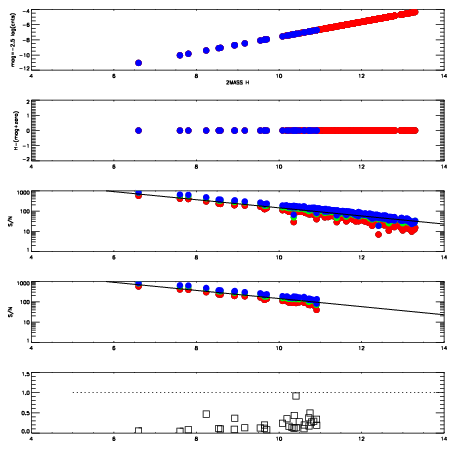


| Frame | Nreads | Zeropoints | Mag plots | Spatial mag deviation | Spatial sky 16325A emission deviations (filled: sky, open: star) | Spatial sky continuum emission | Spatial sky telluric CO2 absorption deviations (filled: H < 10) | |||||||||||||||||||||||
| 0 | 0 |
|
|
|
|
|
|
| IPAIR | NAME | SHIFT | NEWSHIFT | S/N | NAME | SHIFT | NEWSHIFT | S/N |
| 0 | 04030079 | 0.504693 | 0.00000 | 232.336 | 04030080 | 0.00462732 | 0.500066 | 235.254 |
| 1 | 04030083 | 0.502909 | 0.00178397 | 246.599 | 04030084 | 0.00566720 | 0.499026 | 242.426 |
| 2 | 04030082 | 0.501138 | 0.00355500 | 242.725 | 04030081 | 0.00282344 | 0.501870 | 241.894 |
| 3 | 04030078 | 0.502936 | 0.00175697 | 229.032 | 04030073 | 0.00000 | 0.504693 | 224.518 |
| 4 | 04030074 | 0.500268 | 0.00442499 | 216.838 | 04030077 | 0.000755370 | 0.503938 | 223.884 |
| 5 | 04030075 | 0.501240 | 0.00345296 | 213.710 | 04030076 | 0.000714289 | 0.503979 | 220.787 |