| Red | Green | Blue | |
| z | 17.64 | ||
| znorm | Inf | ||
| sky | -Inf | -Inf | -Inf |
| S/N | 20.6 | 39.5 | 43.3 |
| S/N(c) | 0.0 | 0.0 | 0.0 |
| SN(E/C) |
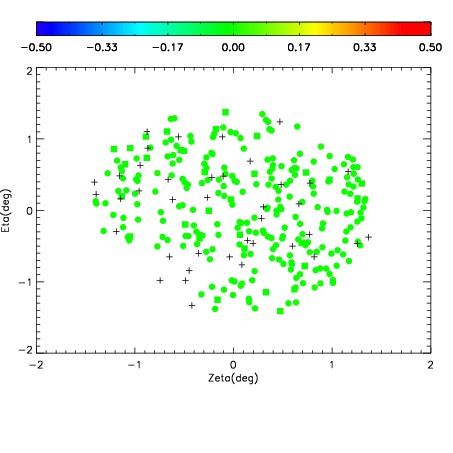
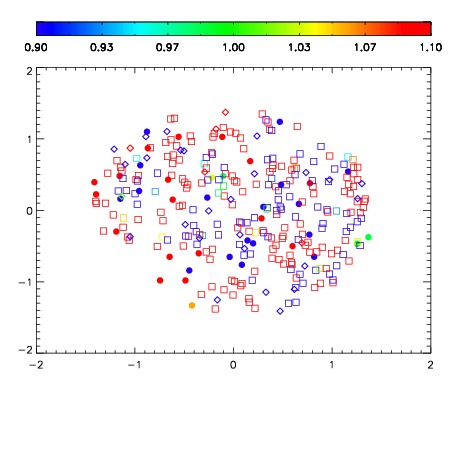
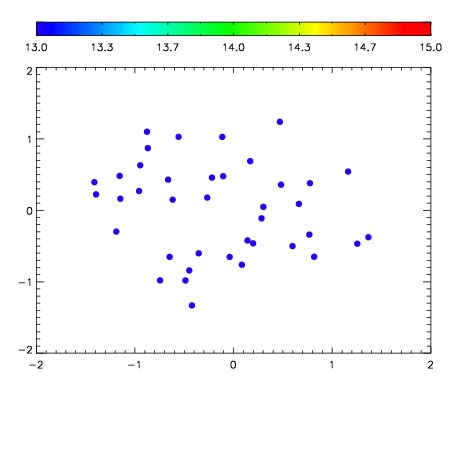

| Frame | Nreads | Zeropoints | Mag plots | Spatial mag deviation | Spatial sky 16325A emission deviations (filled: sky, open: star) | Spatial sky continuum emission | Spatial sky telluric CO2 absorption deviations (filled: H < 10) | |||||||||||||||||||||||
| 0 | 0 |
|
|
|
|
|
|
| IPAIR | NAME | SHIFT | NEWSHIFT | S/N | NAME | SHIFT | NEWSHIFT | S/N |
| 0 | 04270038 | 0.491310 | 0.00000 | 185.854 | 04270036 | -0.00169744 | 0.493007 | 182.138 |
| 1 | 04270033 | 0.489835 | 0.00147501 | 205.626 | 04270032 | 0.00000 | 0.491310 | 197.023 |
| 2 | 04270034 | 0.490434 | 0.000876009 | 201.479 | 04270035 | -0.000273584 | 0.491584 | 187.037 |
| 3 | 04270037 | 0.490175 | 0.00113499 | 187.946 | 04270039 | 0.000356013 | 0.490954 | 185.333 |