| Red | Green | Blue | |
| z | 17.64 | ||
| znorm | Inf | ||
| sky | -Inf | -Inf | -Inf |
| S/N | 27.7 | 48.2 | 56.1 |
| S/N(c) | 0.0 | 0.0 | 0.0 |
| SN(E/C) |
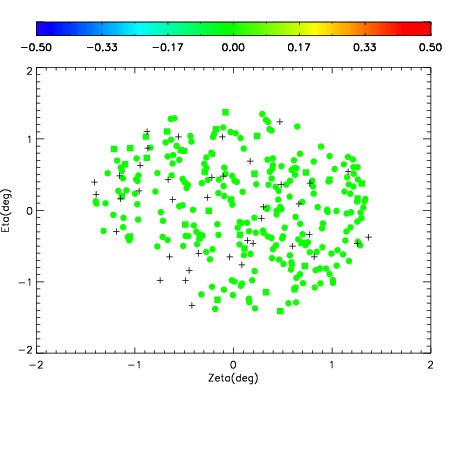
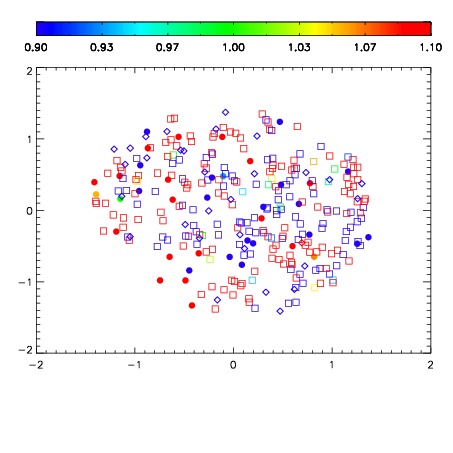
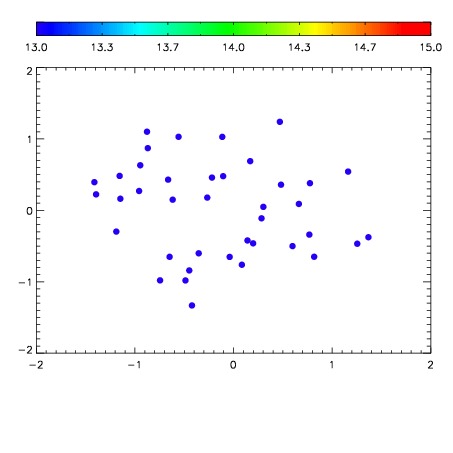

| Frame | Nreads | Zeropoints | Mag plots | Spatial mag deviation | Spatial sky 16325A emission deviations (filled: sky, open: star) | Spatial sky continuum emission | Spatial sky telluric CO2 absorption deviations (filled: H < 10) | |||||||||||||||||||||||
| 0 | 0 |
|
|
|
|
|
|
| IPAIR | NAME | SHIFT | NEWSHIFT | S/N | NAME | SHIFT | NEWSHIFT | S/N |
| 0 | 04280054 | 0.497380 | 0.00000 | 221.400 | 04280055 | 0.00179378 | 0.495586 | 222.296 |
| 1 | 04280058 | 0.495167 | 0.00221300 | 236.287 | 04280059 | 0.00230937 | 0.495071 | 237.299 |
| 2 | 04280053 | 0.493986 | 0.00339398 | 233.735 | 04280052 | 0.00000 | 0.497380 | 229.323 |
| 3 | 04280057 | 0.494238 | 0.00314200 | 231.826 | 04280056 | 0.000769747 | 0.496610 | 229.130 |