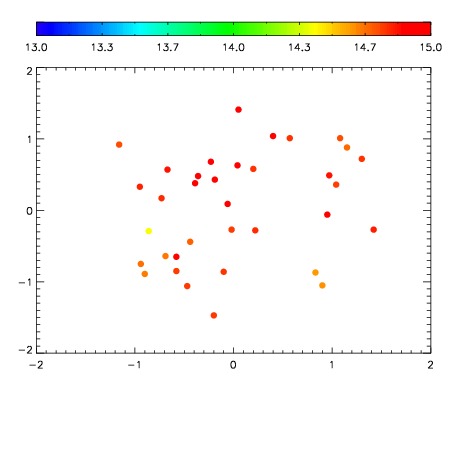
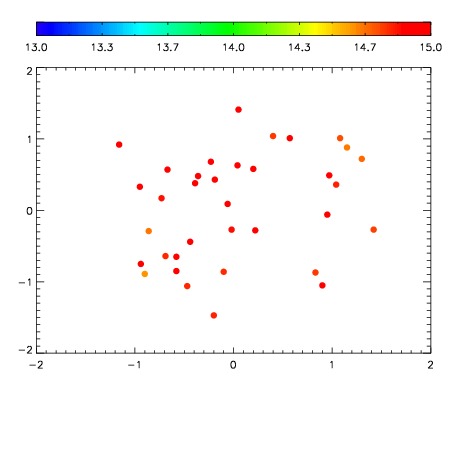
| Frame | Nreads | Zeropoints | Mag plots
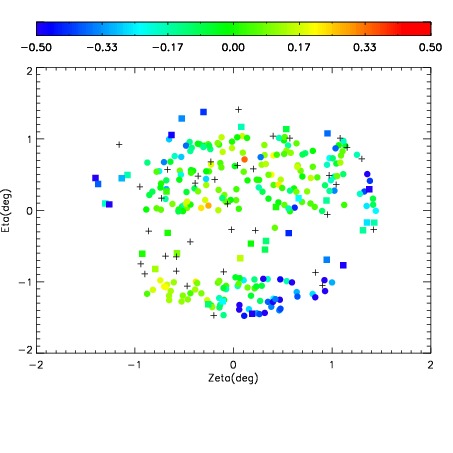
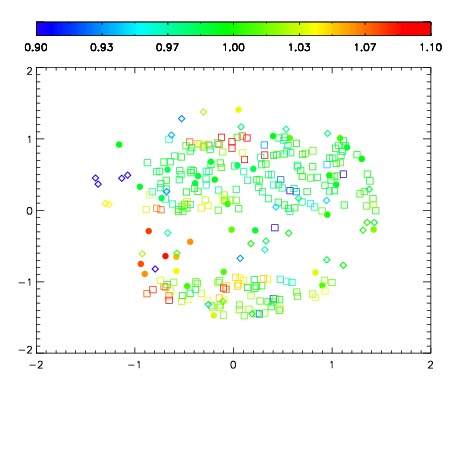
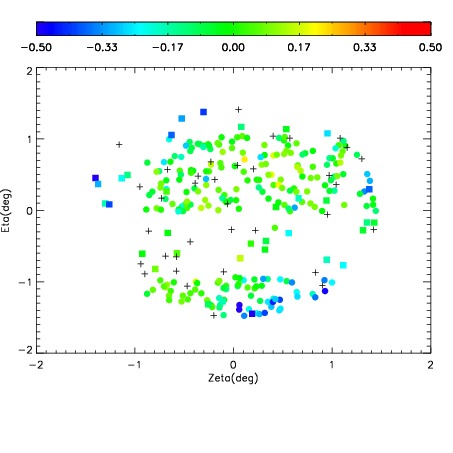
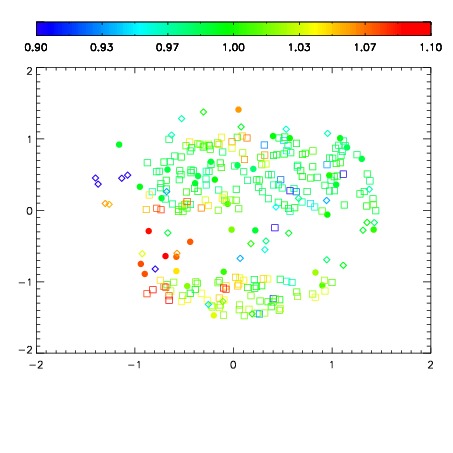
| Spatial mag deviation
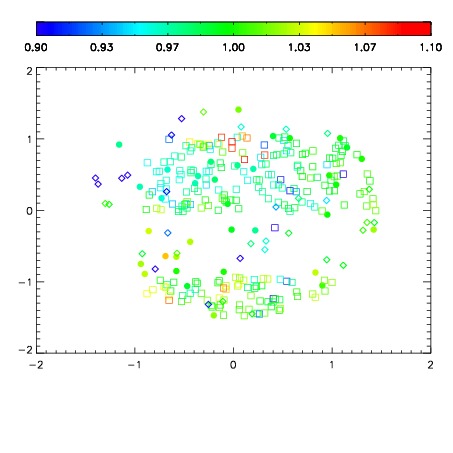
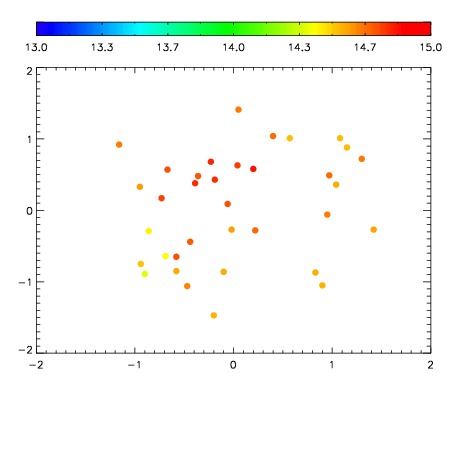
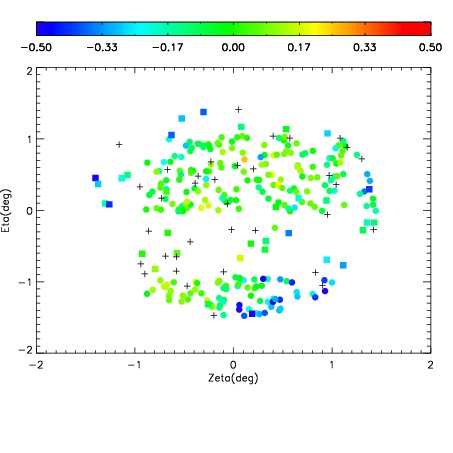
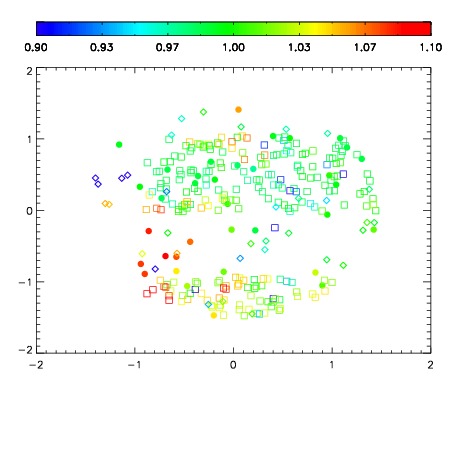
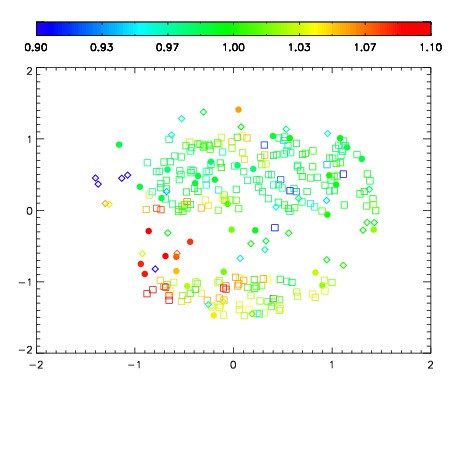
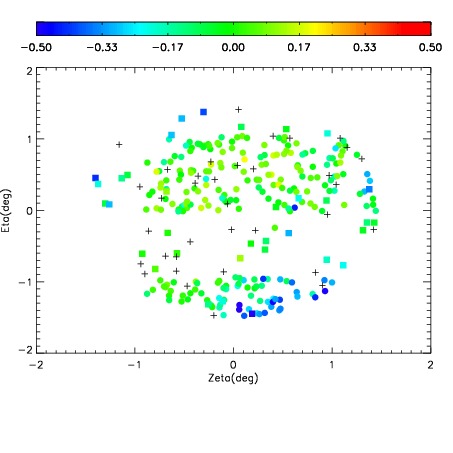
| Spatial sky 16325A emission deviations (filled: sky, open: star)
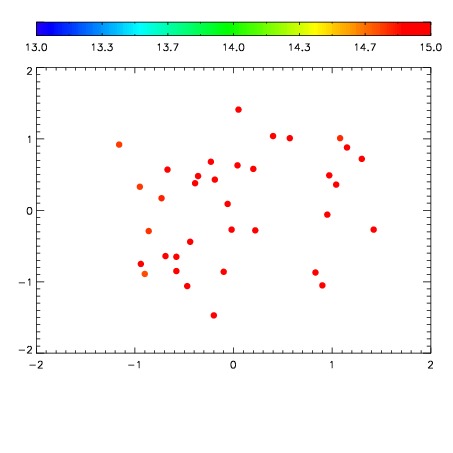
| Spatial sky continuum emission
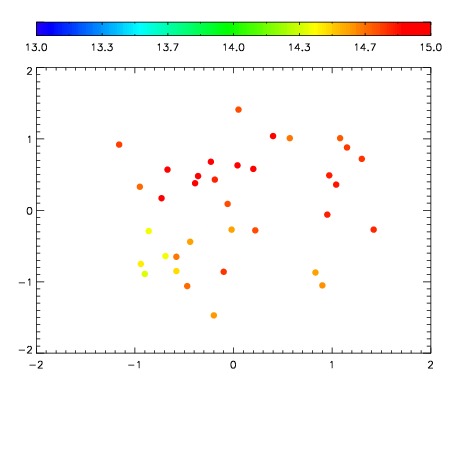
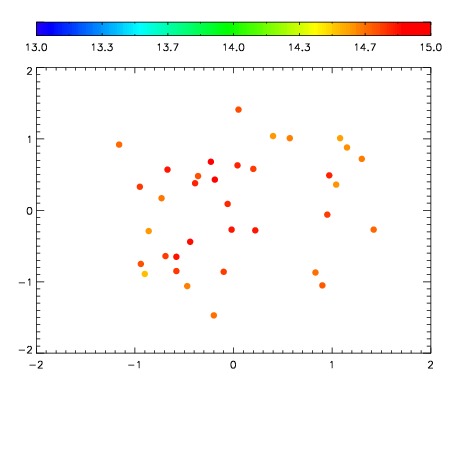
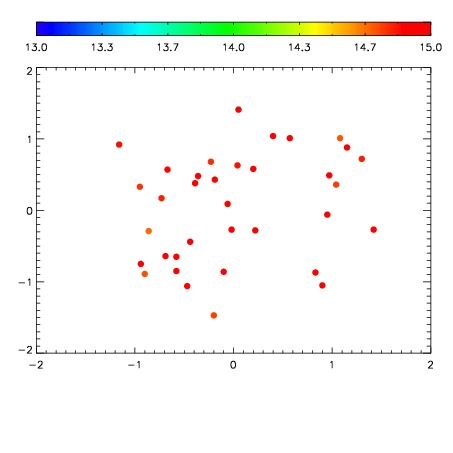
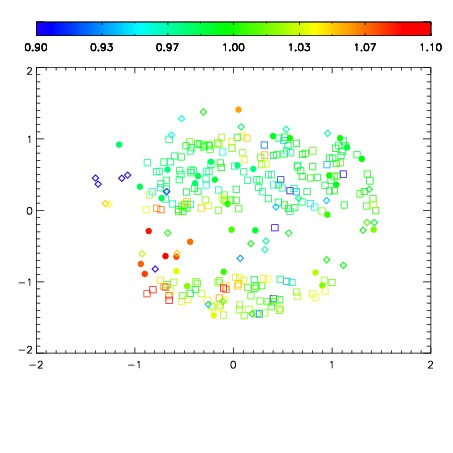
| Spatial sky telluric CO2 absorption deviations (filled: H < 10)
|
| 3980067
| 47
| | Red | Green | Blue
| | z | | 18.89
| | znorm | | 14.71
| | sky | 15.2 | 14.7 | 14.6
| | S/N | 15.2 | 24.6 | 27.3
| | S/N(c) | 13.1 | 22.9 | 26.0
| | SN(E/C) 0.38
|
| 
| 
| 
| 
| 
|
| 3980068
| 47
| | Red | Green | Blue
| | z | | 18.97
| | znorm | | 14.79
| | sky | 15.0 | 14.6 | 15.0
| | S/N | 16.2 | 25.9 | 28.6
| | S/N(c) | 14.1 | 24.3 | 27.3
| | SN(E/C) 0.36
|
| 
| 
| 
| 
| 
|
| 3980069
| 47
| | Red | Green | Blue
| | z | | 18.81
| | znorm | | 14.63
| | sky | 15.0 | 14.8 | 15.0
| | S/N | 14.5 | 23.6 | 26.3
| | S/N(c) | 12.5 | 22.2 | 24.8
| | SN(E/C) 0.39
|
| 
| 
| 
| 
| 
|
| 3980070
| 47
| | Red | Green | Blue
| | z | | 18.76
| | znorm | | 14.58
| | sky | 15.1 | 14.9 | 15.2
| | S/N | 13.8 | 22.9 | 25.0
| | S/N(c) | 11.9 | 21.2 | 23.7
| | SN(E/C) 0.38
|
| 
| 
| 
| 
| 
|
| 3980071
| 47
| | Red | Green | Blue
| | z | | 18.93
| | znorm | | 14.75
| | sky | 15.1 | 14.7 | 14.9
| | S/N | 15.5 | 25.0 | 27.1
| | S/N(c) | 13.5 | 23.5 | 25.8
| | SN(E/C) 0.36
|
| 
| 
| 
| 
| 
|
| 3980072
| 47
| | Red | Green | Blue
| | z | | 18.90
| | znorm | | 14.72
| | sky | 15.1 | 14.8 | 15.1
| | S/N | 15.2 | 24.7 | 26.8
| | S/N(c) | 13.2 | 23.4 | 25.4
| | SN(E/C) 0.36
|
| 
| 
| 
| 
| 
|
| 3980073
| 47
| | Red | Green | Blue
| | z | | 18.85
| | znorm | | 14.67
| | sky | 14.9 | 14.9 | 15.1
| | S/N | 14.6 | 24.0 | 26.0
| | S/N(c) | 12.7 | 22.5 | 24.6
| | SN(E/C) 0.37
|
| 
| 
| 
| 
| 
|
| 3980074
| 47
| | Red | Green | Blue
| | z | | 18.96
| | znorm | | 14.77
| | sky | 15.3 | 14.9 | 14.9
| | S/N | 15.8 | 25.2 | 27.1
| | S/N(c) | 13.8 | 23.6 | 25.6
| | SN(E/C) 0.36
|
| 
| 
| 
| 
| 
|

