| Red | Green | Blue | |
| z | 17.64 | ||
| znorm | Inf | ||
| sky | -Inf | -Inf | -Inf |
| S/N | 26.0 | 45.9 | 50.9 |
| S/N(c) | 0.0 | 0.0 | 0.0 |
| SN(E/C) |
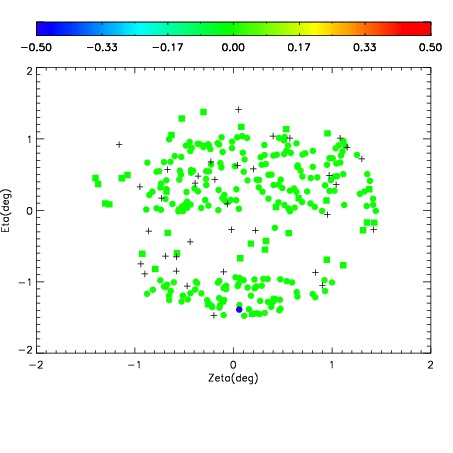
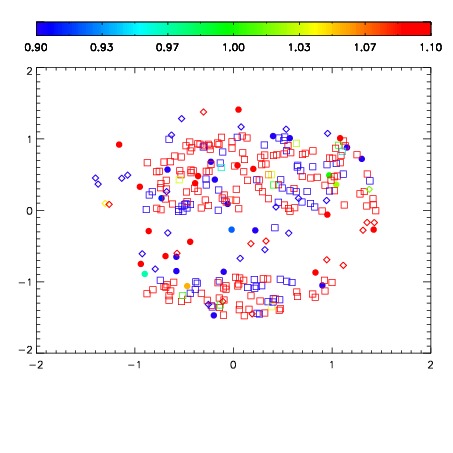


| Frame | Nreads | Zeropoints | Mag plots | Spatial mag deviation | Spatial sky 16325A emission deviations (filled: sky, open: star) | Spatial sky continuum emission | Spatial sky telluric CO2 absorption deviations (filled: H < 10) | |||||||||||||||||||||||
| 0 | 0 |
|
|
|
|
|
|
| IPAIR | NAME | SHIFT | NEWSHIFT | S/N | NAME | SHIFT | NEWSHIFT | S/N |
| 0 | 03980069 | 0.497432 | 0.00000 | 185.077 | 03980070 | 0.00196729 | 0.495465 | 184.193 |
| 1 | 03980068 | 0.497121 | 0.000310987 | 195.379 | 03980074 | 0.00317580 | 0.494256 | 201.545 |
| 2 | 03980072 | 0.494986 | 0.00244600 | 194.960 | 03980071 | 0.000213618 | 0.497218 | 195.343 |
| 3 | 03980073 | 0.496565 | 0.000866979 | 190.942 | 03980067 | 0.00000 | 0.497432 | 194.501 |