| Red | Green | Blue | |
| z | 17.64 | ||
| znorm | Inf | ||
| sky | -Inf | -Inf | -Inf |
| S/N | 27.8 | 48.5 | 52.5 |
| S/N(c) | 0.0 | 0.0 | 0.0 |
| SN(E/C) |
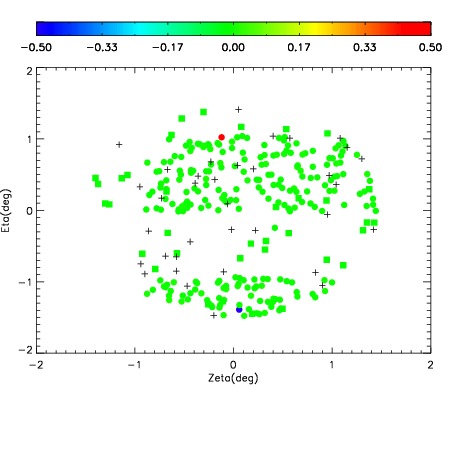
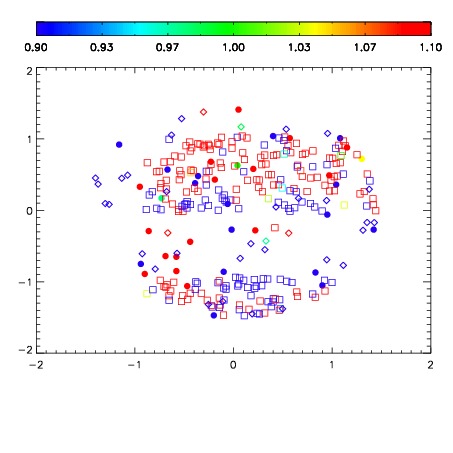
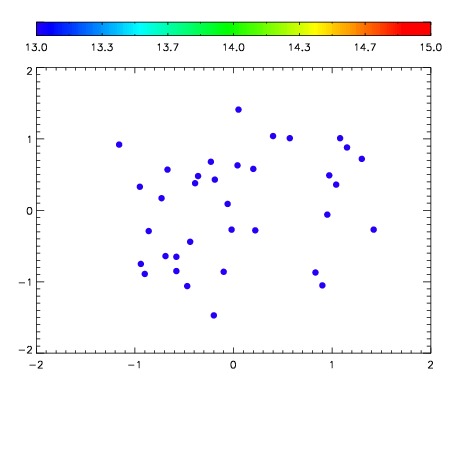

| Frame | Nreads | Zeropoints | Mag plots | Spatial mag deviation | Spatial sky 16325A emission deviations (filled: sky, open: star) | Spatial sky continuum emission | Spatial sky telluric CO2 absorption deviations (filled: H < 10) | |||||||||||||||||||||||
| 0 | 0 |
|
|
|
|
|
|
| IPAIR | NAME | SHIFT | NEWSHIFT | S/N | NAME | SHIFT | NEWSHIFT | S/N |
| 0 | 04280069 | 0.500514 | 0.00000 | 187.036 | 04280067 | 0.00161575 | 0.498898 | 193.885 |
| 1 | 04280065 | 0.493763 | 0.00675097 | 213.417 | 04280066 | 0.00179401 | 0.498720 | 214.748 |
| 2 | 04280064 | 0.490462 | 0.0100520 | 203.922 | 04280063 | 0.00000 | 0.500514 | 210.054 |
| 3 | 04280068 | 0.492992 | 0.00752196 | 184.109 | 04280070 | 0.00303452 | 0.497479 | 171.599 |