| Red | Green | Blue | |
| z | 17.64 | ||
| znorm | Inf | ||
| sky | -NaN | -Inf | -Inf |
| S/N | 26.3 | 46.6 | 47.8 |
| S/N(c) | 0.0 | 0.0 | 0.0 |
| SN(E/C) |
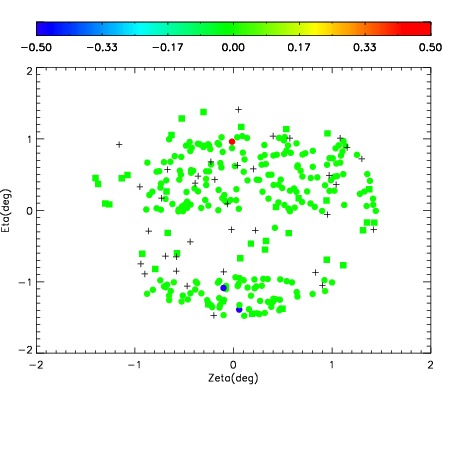
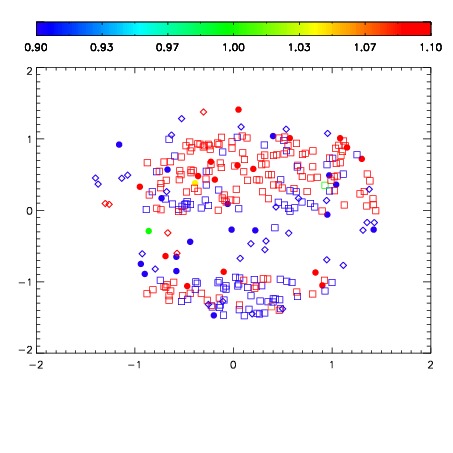
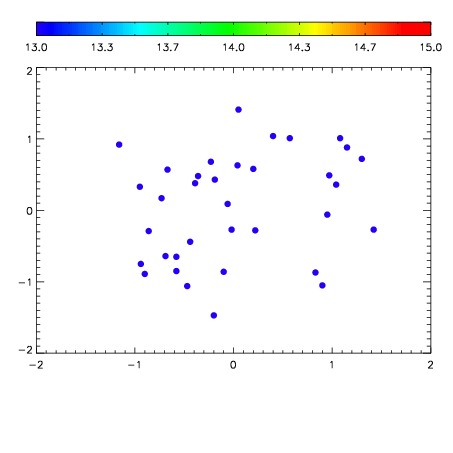

| Frame | Nreads | Zeropoints | Mag plots | Spatial mag deviation | Spatial sky 16325A emission deviations (filled: sky, open: star) | Spatial sky continuum emission | Spatial sky telluric CO2 absorption deviations (filled: H < 10) | |||||||||||||||||||||||
| 0 | 0 |
|
|
|
|
|
|
| IPAIR | NAME | SHIFT | NEWSHIFT | S/N | NAME | SHIFT | NEWSHIFT | S/N |
| 0 | 04360027 | 0.493915 | 0.00000 | 208.669 | 04360028 | -0.000839410 | 0.494754 | 209.556 |
| 1 | 04360026 | 0.486675 | 0.00724000 | 206.940 | 04360021 | 0.00000 | 0.493915 | 190.283 |
| 2 | 04360023 | 0.490743 | 0.00317198 | 197.245 | 04360024 | 0.00148443 | 0.492431 | 178.734 |
| 3 | 04360022 | 0.488306 | 0.00560901 | 185.154 | 04360025 | -0.00309553 | 0.497011 | 177.318 |