| Red | Green | Blue | |
| z | 17.64 | ||
| znorm | Inf | ||
| sky | -Inf | -Inf | -Inf |
| S/N | 26.3 | 46.7 | 52.0 |
| S/N(c) | 0.0 | 0.0 | 0.0 |
| SN(E/C) |
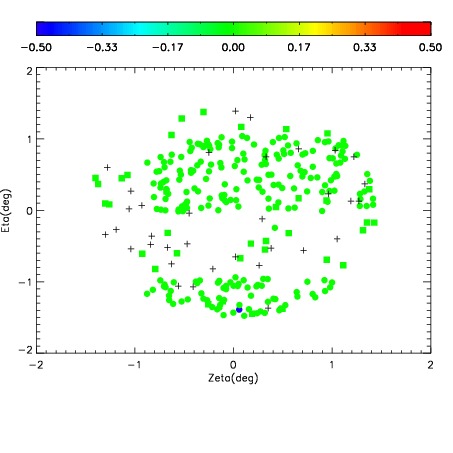
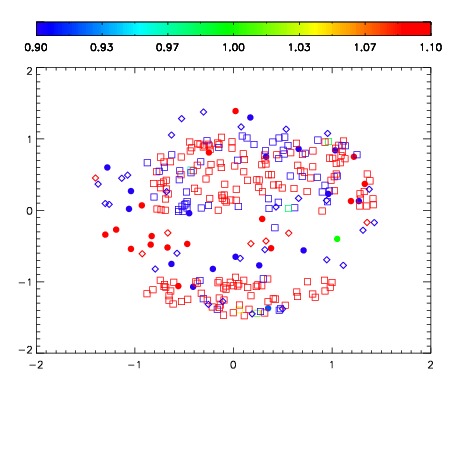
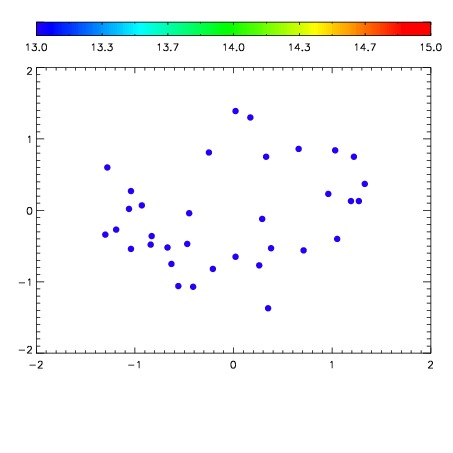

| Frame | Nreads | Zeropoints | Mag plots | Spatial mag deviation | Spatial sky 16325A emission deviations (filled: sky, open: star) | Spatial sky continuum emission | Spatial sky telluric CO2 absorption deviations (filled: H < 10) | |||||||||||||||||||||||
| 0 | 0 |
|
|
|
|
|
|
| IPAIR | NAME | SHIFT | NEWSHIFT | S/N | NAME | SHIFT | NEWSHIFT | S/N |
| 0 | 05240021 | 0.499994 | 0.00000 | 225.925 | 05240022 | 0.00298258 | 0.497011 | 225.484 |
| 1 | 05240016 | 0.497660 | 0.00233400 | 230.062 | 05240018 | 0.00335051 | 0.496644 | 228.088 |
| 2 | 05240017 | 0.498028 | 0.00196600 | 228.818 | 05240015 | 0.00000 | 0.499994 | 227.776 |
| 3 | 05240020 | 0.498891 | 0.00110301 | 228.627 | 05240019 | 0.00143519 | 0.498559 | 226.369 |