| Red | Green | Blue | |
| z | 17.64 | ||
| znorm | Inf | ||
| sky | -Inf | -Inf | -Inf |
| S/N | 25.8 | 44.5 | 50.6 |
| S/N(c) | 0.0 | 0.0 | 0.0 |
| SN(E/C) |
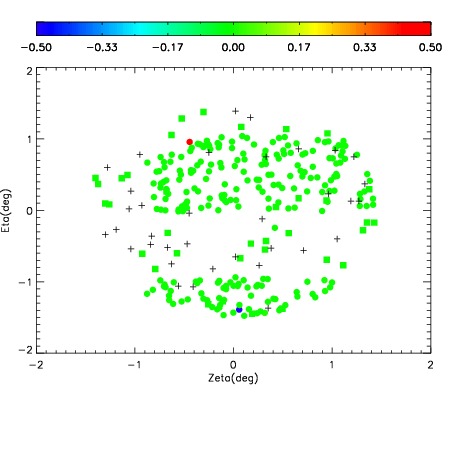

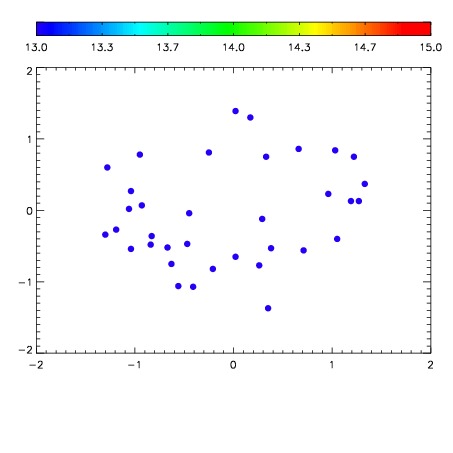

| Frame | Nreads | Zeropoints | Mag plots | Spatial mag deviation | Spatial sky 16325A emission deviations (filled: sky, open: star) | Spatial sky continuum emission | Spatial sky telluric CO2 absorption deviations (filled: H < 10) | |||||||||||||||||||||||
| 0 | 0 |
|
|
|
|
|
|
| IPAIR | NAME | SHIFT | NEWSHIFT | S/N | NAME | SHIFT | NEWSHIFT | S/N |
| 0 | 07520083 | 0.472759 | 0.00000 | 213.318 | 07520082 | 0.00280709 | 0.469952 | 211.061 |
| 1 | 07520084 | 0.472751 | 8.01682e-06 | 216.166 | 07520085 | 0.00627124 | 0.466488 | 212.874 |
| 2 | 07520080 | 0.471670 | 0.00108901 | 211.715 | 07520078 | 0.00000 | 0.472759 | 207.098 |
| 3 | 07520079 | 0.470849 | 0.00191000 | 209.266 | 07520081 | 0.00335869 | 0.469400 | 204.913 |