| Red | Green | Blue | |
| z | 17.64 | ||
| znorm | Inf | ||
| sky | -NaN | -NaN | -Inf |
| S/N | 23.7 | 44.4 | 48.4 |
| S/N(c) | 0.0 | 0.0 | 0.0 |
| SN(E/C) |
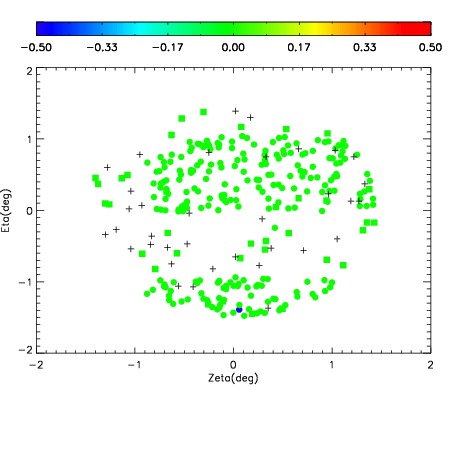
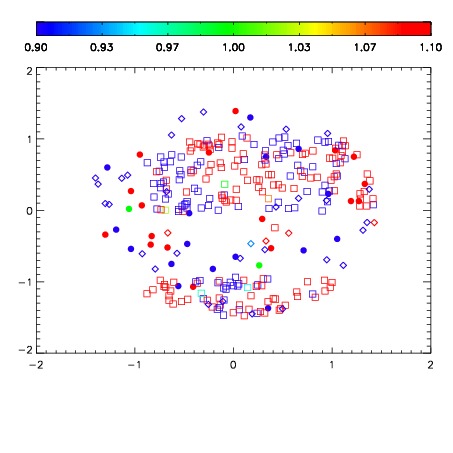
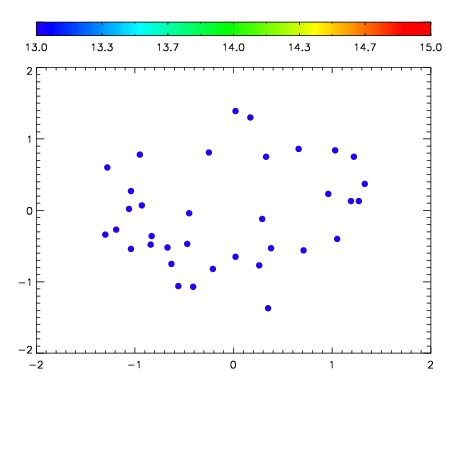

| Frame | Nreads | Zeropoints | Mag plots | Spatial mag deviation | Spatial sky 16325A emission deviations (filled: sky, open: star) | Spatial sky continuum emission | Spatial sky telluric CO2 absorption deviations (filled: H < 10) | |||||||||||||||||||||||
| 0 | 0 |
|
|
|
|
|
|
| IPAIR | NAME | SHIFT | NEWSHIFT | S/N | NAME | SHIFT | NEWSHIFT | S/N |
| 0 | 07620043 | 0.488938 | 0.00000 | 163.228 | 07620037 | 0.00000 | 0.488938 | 187.729 |
| 1 | 07620039 | 0.487785 | 0.00115299 | 212.547 | 07620040 | 0.00113563 | 0.487802 | 213.302 |
| 2 | 07620038 | 0.486770 | 0.00216800 | 209.594 | 07620041 | 0.000662078 | 0.488276 | 207.333 |
| 3 | 07620042 | 0.487847 | 0.00109100 | 191.588 | 07620044 | 0.00179206 | 0.487146 | 197.985 |