| Red | Green | Blue | |
| z | 17.64 | ||
| znorm | Inf | ||
| sky | -Inf | -Inf | -Inf |
| S/N | 25.9 | 47.3 | 53.2 |
| S/N(c) | 0.0 | 0.0 | 0.0 |
| SN(E/C) |
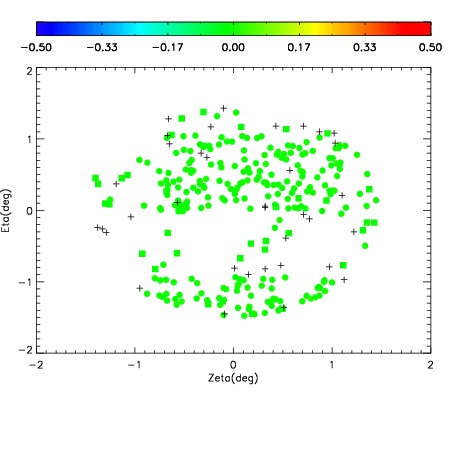
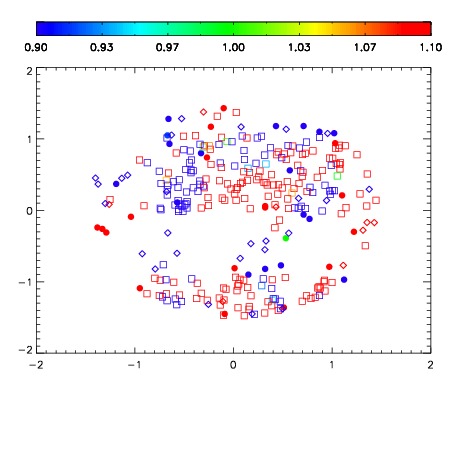
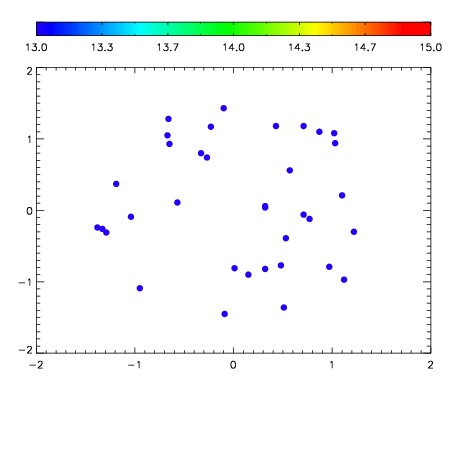

| Frame | Nreads | Zeropoints | Mag plots | Spatial mag deviation | Spatial sky 16325A emission deviations (filled: sky, open: star) | Spatial sky continuum emission | Spatial sky telluric CO2 absorption deviations (filled: H < 10) | |||||||||||||||||||||||
| 0 | 0 |
|
|
|
|
|
|
| IPAIR | NAME | SHIFT | NEWSHIFT | S/N | NAME | SHIFT | NEWSHIFT | S/N |
| 0 | 07530088 | 0.479756 | 0.00000 | 219.740 | 07530087 | 0.00189972 | 0.477856 | 209.453 |
| 1 | 07530089 | 0.479600 | 0.000155985 | 228.433 | 07530090 | 0.00195590 | 0.477800 | 218.312 |
| 2 | 07530085 | 0.478136 | 0.00161999 | 219.324 | 07530086 | 0.00315183 | 0.476604 | 204.518 |
| 3 | 07530084 | 0.478452 | 0.00130400 | 209.484 | 07530083 | 0.00000 | 0.479756 | 198.265 |