| Red | Green | Blue | |
| z | 17.64 | ||
| znorm | Inf | ||
| sky | -Inf | -Inf | -Inf |
| S/N | 23.1 | 44.1 | 48.9 |
| S/N(c) | 0.0 | 0.0 | 0.0 |
| SN(E/C) |
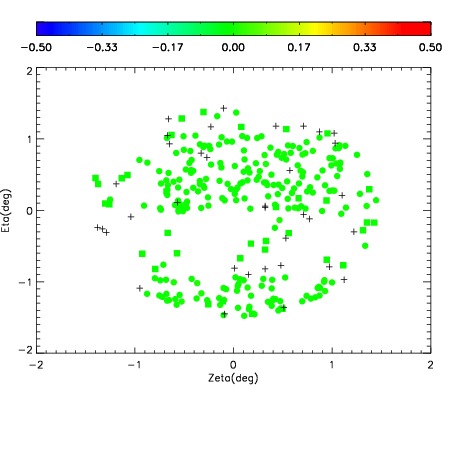
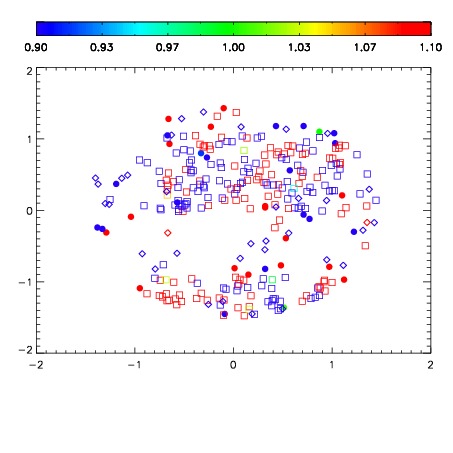
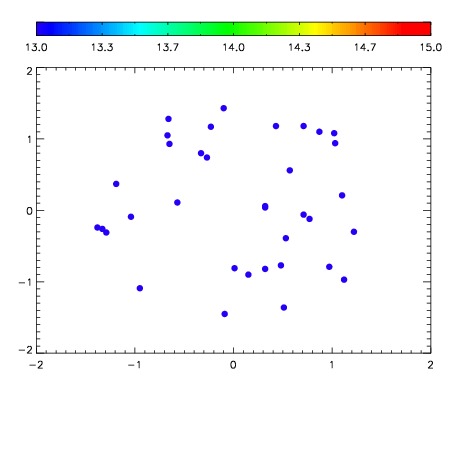

| Frame | Nreads | Zeropoints | Mag plots | Spatial mag deviation | Spatial sky 16325A emission deviations (filled: sky, open: star) | Spatial sky continuum emission | Spatial sky telluric CO2 absorption deviations (filled: H < 10) | |||||||||||||||||||||||
| 0 | 0 |
|
|
|
|
|
|
| IPAIR | NAME | SHIFT | NEWSHIFT | S/N | NAME | SHIFT | NEWSHIFT | S/N |
| 0 | 07630038 | 0.474490 | 0.00000 | 185.400 | 07630035 | 0.00159377 | 0.472896 | 185.164 |
| 1 | 07630033 | 0.472721 | 0.00176898 | 191.847 | 07630032 | 0.00000 | 0.474490 | 188.348 |
| 2 | 07630034 | 0.473768 | 0.000721991 | 175.356 | 07630039 | 0.00153451 | 0.472955 | 168.949 |
| 3 | 07630037 | 0.471990 | 0.00250000 | 168.972 | 07630036 | -0.00193935 | 0.476429 | 165.594 |