| Frame | Nreads | Zeropoints | Mag plots
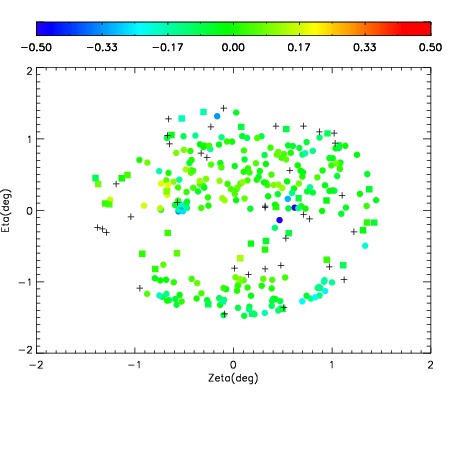
| Spatial mag deviation
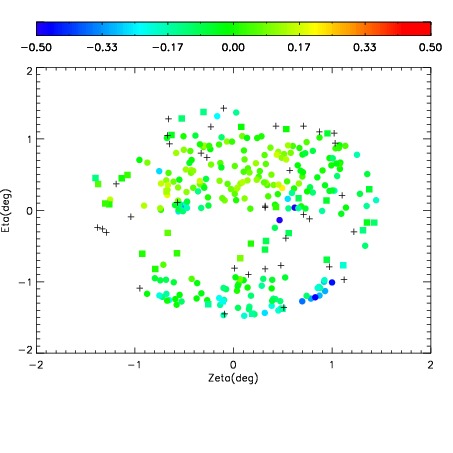
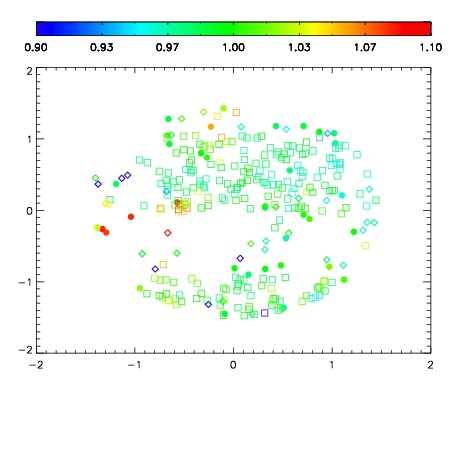
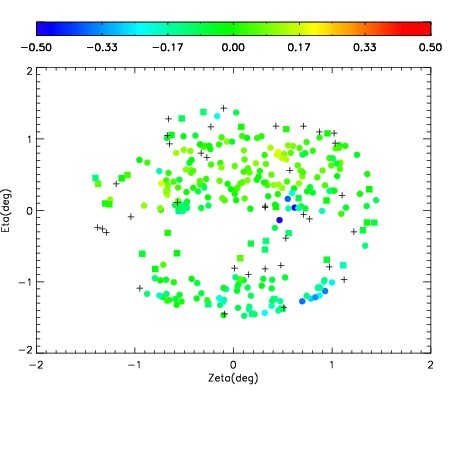
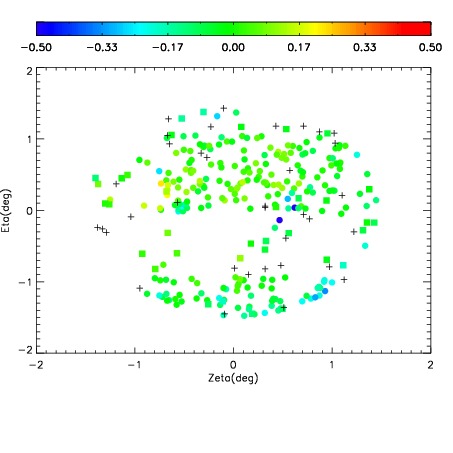
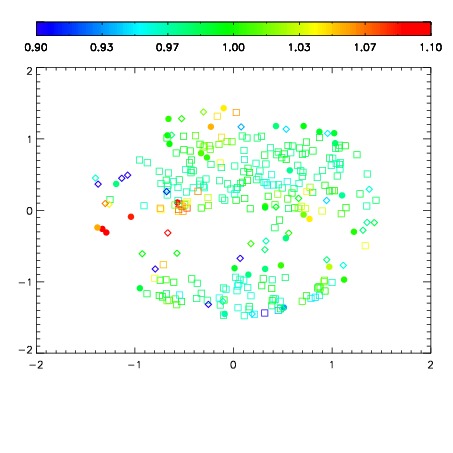
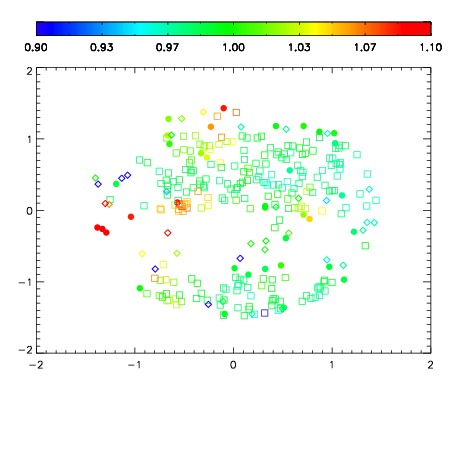
| Spatial sky 16325A emission deviations (filled: sky, open: star)
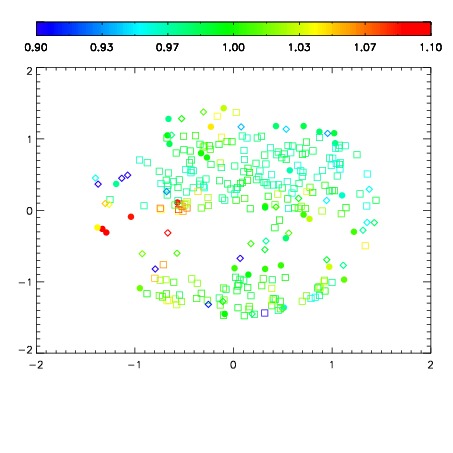
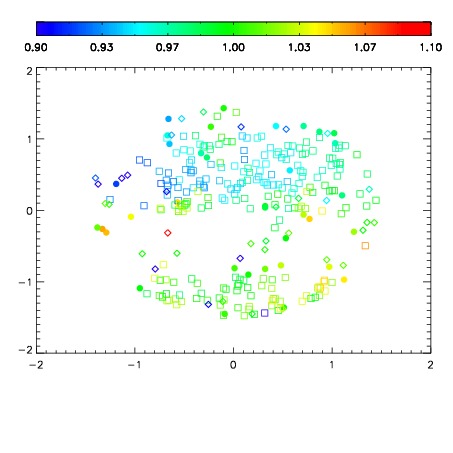
| Spatial sky continuum emission
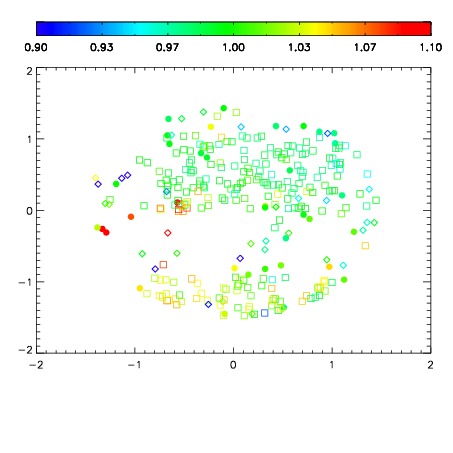
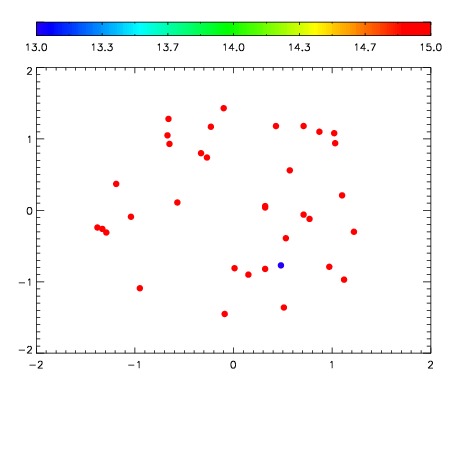
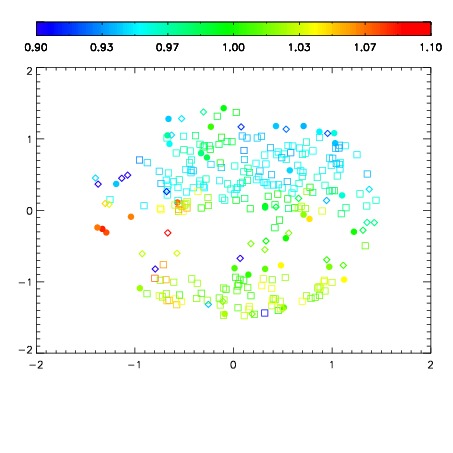
| Spatial sky telluric CO2 absorption deviations (filled: H < 10)
|
| 7840042
| 47
| | Red | Green | Blue
| | z | | 18.02
| | znorm | | 13.84
| | sky | 16.1 | 15.6 | 14.8
| | S/N | 8.0 | 16.4 | 15.8
| | S/N(c) | 7.2 | 15.1 | 15.2
| | SN(E/C) 0.55
|
| 
| 
| 
| 
| 
|
| 7840043
| 47
| | Red | Green | Blue
| | z | | 17.77
| | znorm | | 13.59
| | sky | 15.6 | 15.5 | 15.5
| | S/N | 6.4 | 13.9 | 13.7
| | S/N(c) | 5.7 | 12.5 | 13.0
| | SN(E/C) 0.59
|
| 
| 
| 
| 
| 
|
| 7840044
| 47
| | Red | Green | Blue
| | z | | 17.90
| | znorm | | 13.72
| | sky | 15.3 | 15.6 | 15.5
| | S/N | 7.3 | 15.1 | 15.0
| | S/N(c) | 6.4 | 13.6 | 14.1
| | SN(E/C) 0.58
|
| 
| 
| 
| 
| 
|
| 7840045
| 47
| | Red | Green | Blue
| | z | | 17.76
| | znorm | | 13.58
| | sky | 15.5 | 15.5 | 15.5
| | S/N | 6.2 | 13.5 | 13.5
| | S/N(c) | 5.5 | 12.4 | 13.0
| | SN(E/C) 0.62
|
| 
| 
| 
| 
| 
|
| 7840046
| 47
| | Red | Green | Blue
| | z | | 17.99
| | znorm | | 13.81
| | sky | 15.5 | 15.6 | 15.4
| | S/N | 7.8 | 16.0 | 16.2
| | S/N(c) | 6.8 | 14.4 | 15.4
| | SN(E/C) 0.57
|
| 
| 
| 
| 
| 
|
| 7840047
| 47
| | Red | Green | Blue
| | z | | 17.85
| | znorm | | 13.67
| | sky | 15.6 | 15.6 | 15.6
| | S/N | 6.7 | 14.1 | 14.2
| | S/N(c) | 5.7 | 12.8 | 13.3
| | SN(E/C) 0.57
|
| 
| 
| 
| 
| 
|
| 7840048
| 47
| | Red | Green | Blue
| | z | | 17.87
| | znorm | | 13.69
| | sky | 15.8 | 15.6 | 15.4
| | S/N | 7.0 | 14.5 | 14.4
| | S/N(c) | 6.0 | 13.0 | 13.8
| | SN(E/C) 0.61
|
| 
| 
| 
| 
| 
|
| 7840049
| 47
| | Red | Green | Blue
| | z | | 17.81
| | znorm | | 13.63
| | sky | 15.7 | 15.4 | 15.6
| | S/N | 6.6 | 13.8 | 14.0
| | S/N(c) | 5.7 | 12.5 | 13.3
| | SN(E/C) 0.60
|
| 
| 
| 
| 
| 
|