| Red | Green | Blue | |
| z | 17.65 | ||
| znorm | Inf | ||
| sky | -Inf | -Inf | -Inf |
| S/N | 12.2 | 26.7 | 27.4 |
| S/N(c) | 0.0 | 0.0 | 0.0 |
| SN(E/C) |
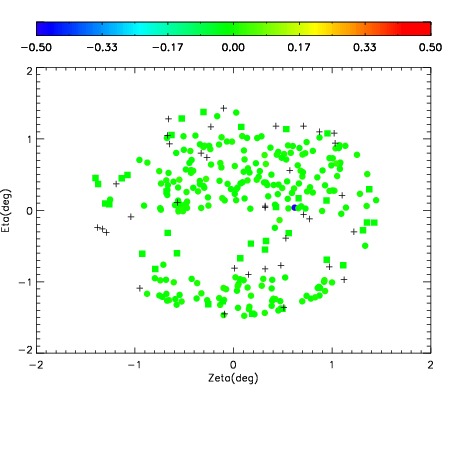
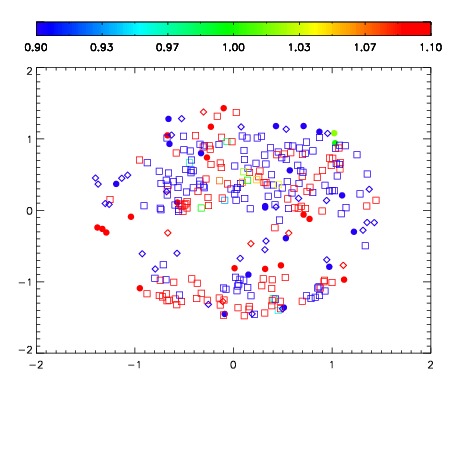
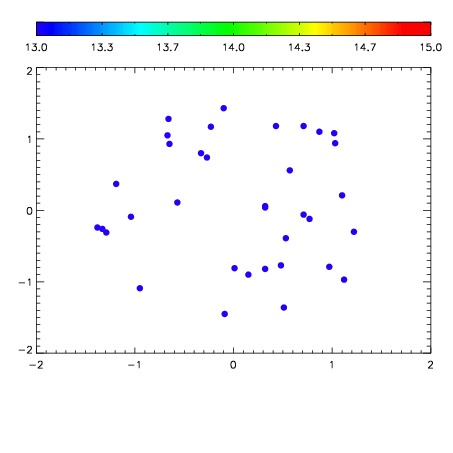

| Frame | Nreads | Zeropoints | Mag plots | Spatial mag deviation | Spatial sky 16325A emission deviations (filled: sky, open: star) | Spatial sky continuum emission | Spatial sky telluric CO2 absorption deviations (filled: H < 10) | |||||||||||||||||||||||
| 0 | 0 |
|
|
|
|
|
|
| IPAIR | NAME | SHIFT | NEWSHIFT | S/N | NAME | SHIFT | NEWSHIFT | S/N |
| 0 | 07840048 | 0.480712 | 0.00000 | 123.625 | 07840046 | 0.00374258 | 0.476969 | 134.000 |
| 1 | 07840044 | 0.477947 | 0.00276500 | 126.688 | 07840042 | 0.00000 | 0.480712 | 134.939 |
| 2 | 07840047 | 0.480525 | 0.000187010 | 123.356 | 07840049 | 0.00996044 | 0.470752 | 120.496 |
| 3 | 07840043 | 0.476789 | 0.00392300 | 120.239 | 07840045 | 0.00148067 | 0.479231 | 116.342 |