| Red | Green | Blue | |
| z | 17.64 | ||
| znorm | Inf | ||
| sky | -NaN | -Inf | -Inf |
| S/N | 26.0 | 47.3 | 52.7 |
| S/N(c) | 0.0 | 0.0 | 0.0 |
| SN(E/C) |
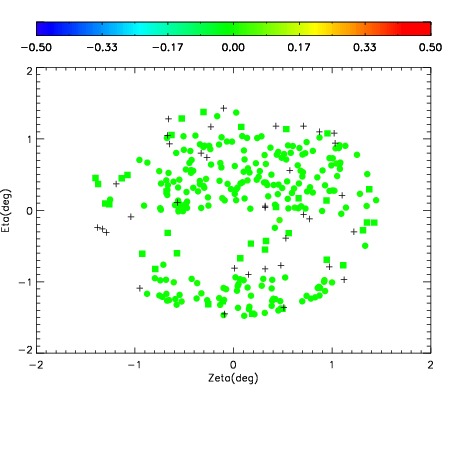

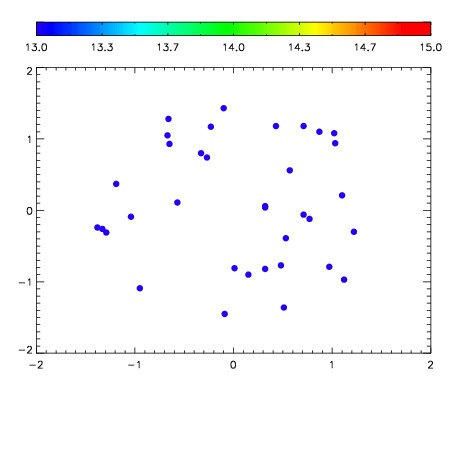

| Frame | Nreads | Zeropoints | Mag plots | Spatial mag deviation | Spatial sky 16325A emission deviations (filled: sky, open: star) | Spatial sky continuum emission | Spatial sky telluric CO2 absorption deviations (filled: H < 10) | |||||||||||||||||||||||
| 0 | 0 |
|
|
|
|
|
|
| IPAIR | NAME | SHIFT | NEWSHIFT | S/N | NAME | SHIFT | NEWSHIFT | S/N |
| 0 | 07850065 | 0.483981 | 0.00000 | 201.373 | 07850059 | 0.00000 | 0.483981 | 197.890 |
| 1 | 07850064 | 0.482983 | 0.000998020 | 200.043 | 07850066 | 0.00803318 | 0.475948 | 197.469 |
| 2 | 07850060 | 0.479075 | 0.00490600 | 199.697 | 07850062 | 0.00157538 | 0.482406 | 192.211 |
| 3 | 07850061 | 0.480178 | 0.00380301 | 199.554 | 07850063 | 0.00326473 | 0.480716 | 190.995 |