| Red | Green | Blue | |
| z | 17.64 | ||
| znorm | Inf | ||
| sky | -Inf | -NaN | -Inf |
| S/N | 28.7 | 48.5 | 61.1 |
| S/N(c) | 0.0 | 0.0 | 0.0 |
| SN(E/C) |
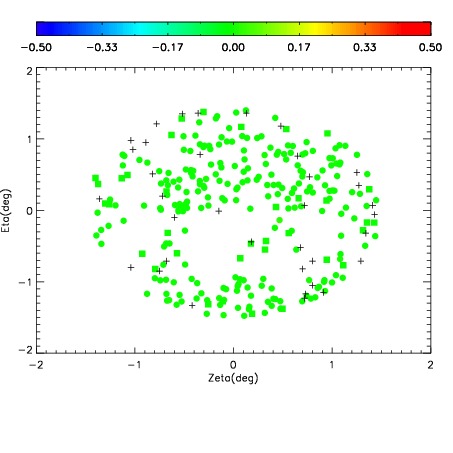
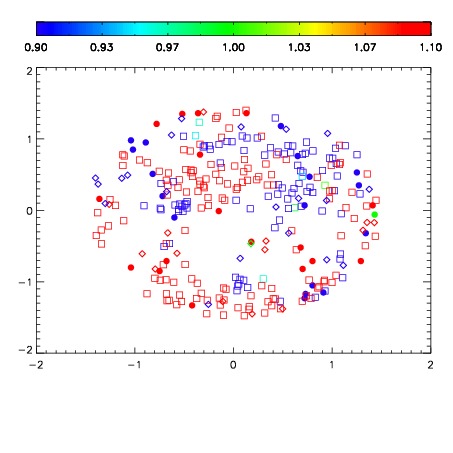
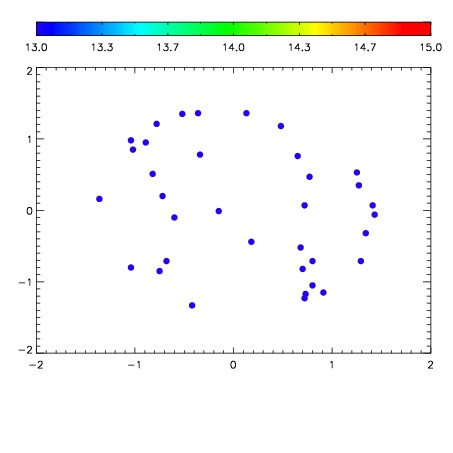

| Frame | Nreads | Zeropoints | Mag plots | Spatial mag deviation | Spatial sky 16325A emission deviations (filled: sky, open: star) | Spatial sky continuum emission | Spatial sky telluric CO2 absorption deviations (filled: H < 10) | |||||||||||||||||||||||
| 0 | 0 |
|
|
|
|
|
|
| IPAIR | NAME | SHIFT | NEWSHIFT | S/N | NAME | SHIFT | NEWSHIFT | S/N |
| 0 | 07540091 | 0.477240 | 0.00000 | 227.237 | 07540089 | 0.000396155 | 0.476844 | 230.643 |
| 1 | 07540087 | 0.476808 | 0.000431985 | 228.549 | 07540088 | 0.00260093 | 0.474639 | 232.085 |
| 2 | 07540086 | 0.476234 | 0.00100601 | 227.150 | 07540092 | -0.0129482 | 0.490188 | 228.194 |
| 3 | 07540090 | 0.476959 | 0.000281006 | 226.196 | 07540085 | 0.00000 | 0.477240 | 224.967 |