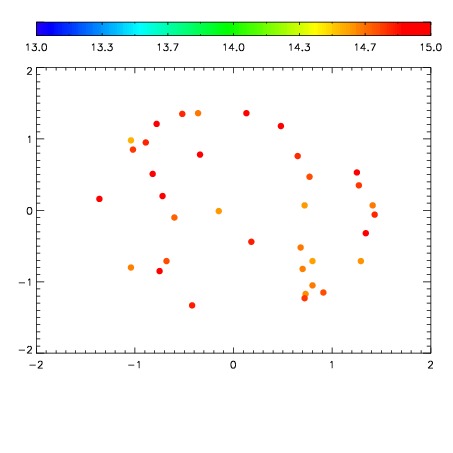
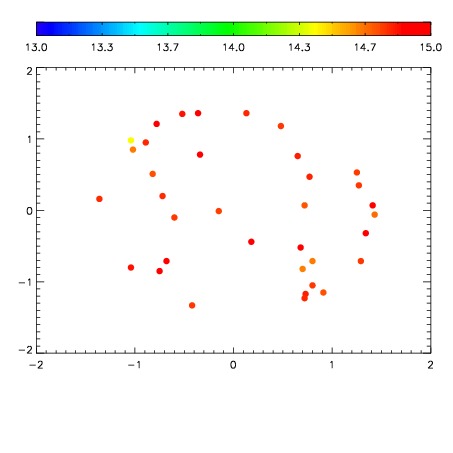
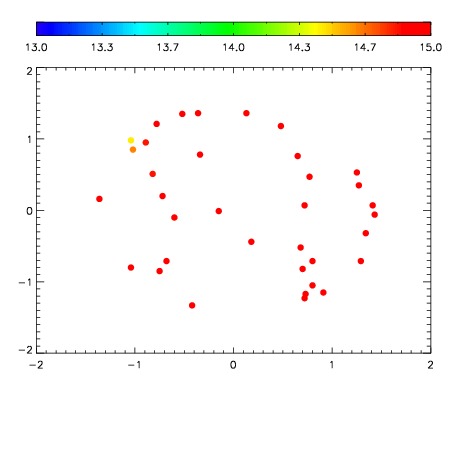
| Frame | Nreads | Zeropoints | Mag plots
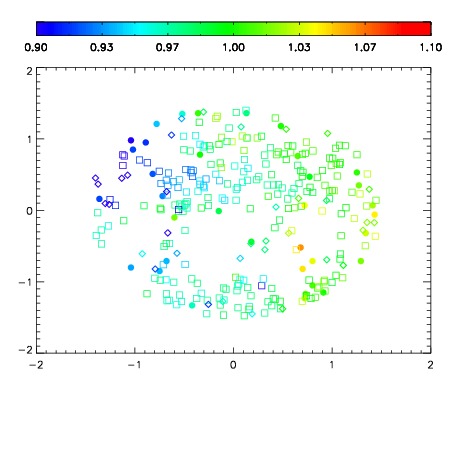
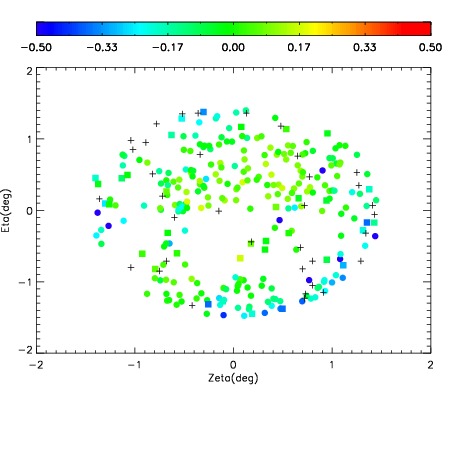
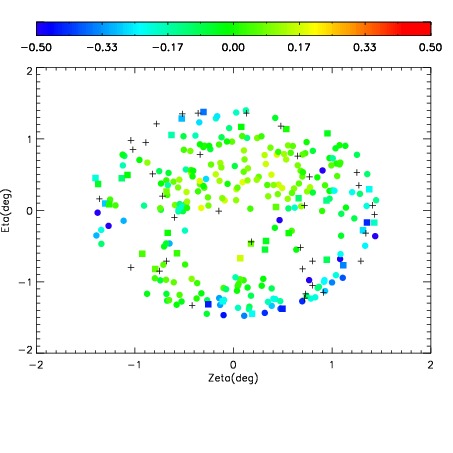
| Spatial mag deviation
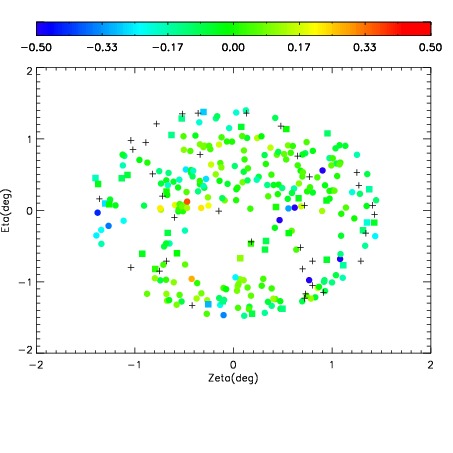
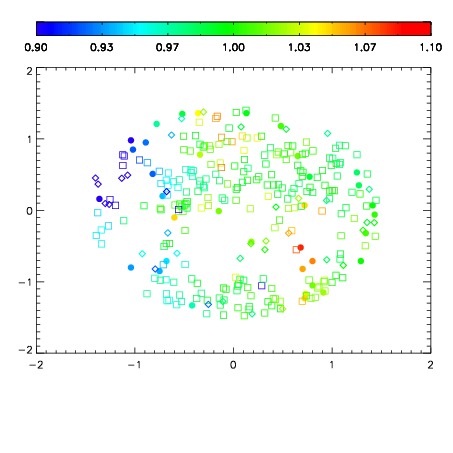
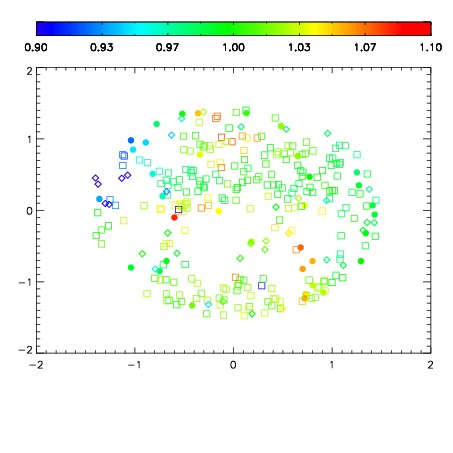
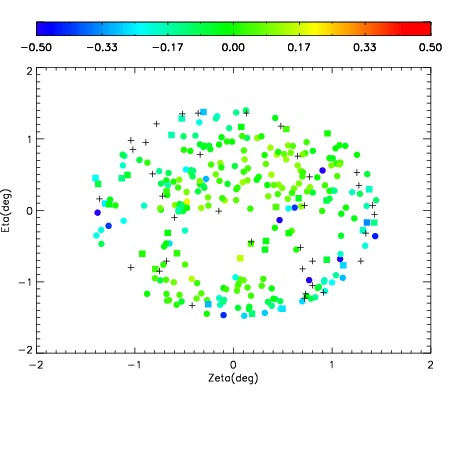
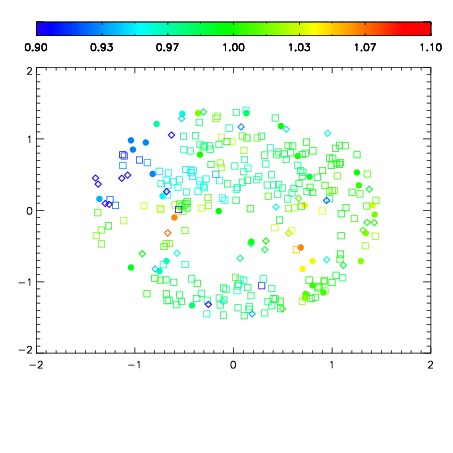
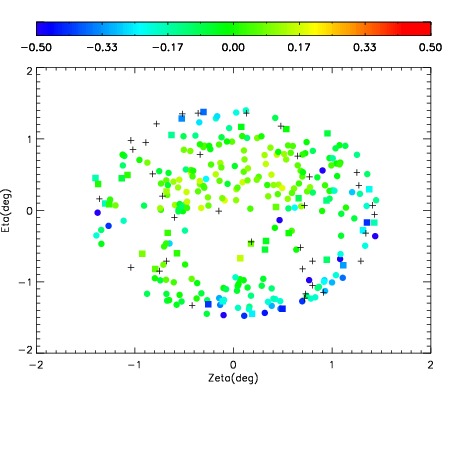
| Spatial sky 16325A emission deviations (filled: sky, open: star)
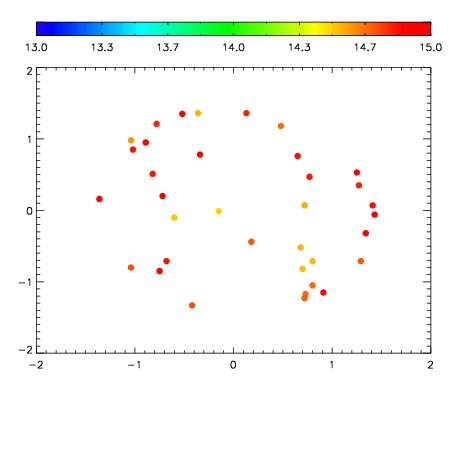
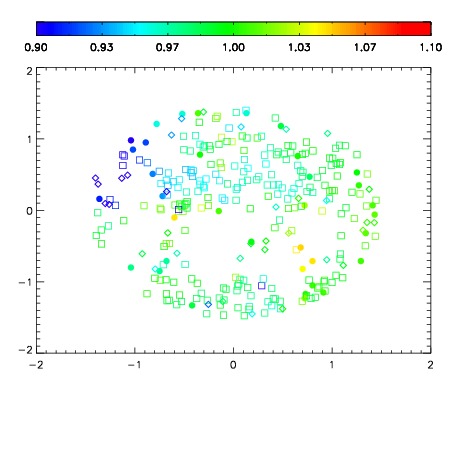
| Spatial sky continuum emission
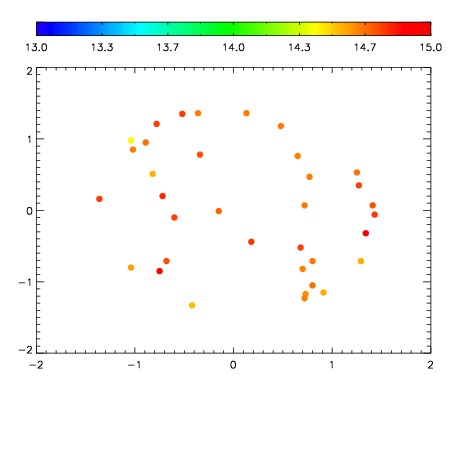
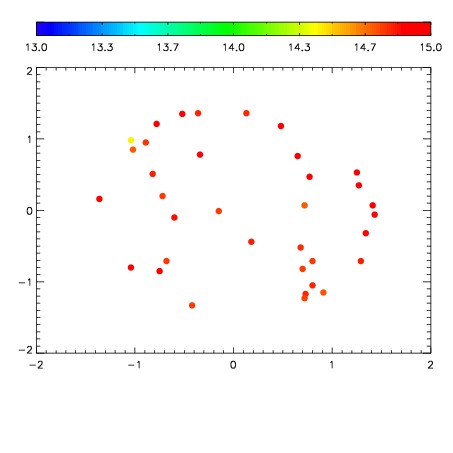
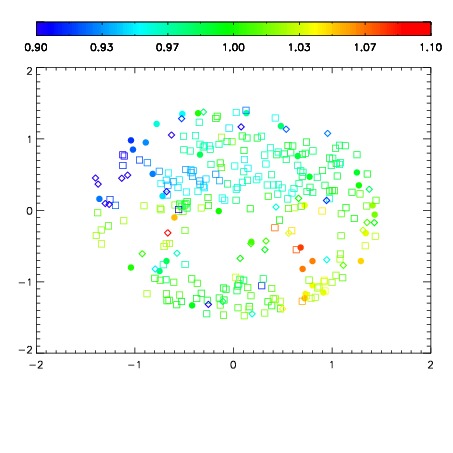
| Spatial sky telluric CO2 absorption deviations (filled: H < 10)
|
| 7900037
| 47
| | Red | Green | Blue
| | z | | 17.89
| | znorm | | 13.71
| | sky | 15.1 | 14.8 | 14.7
| | S/N | 5.7 | 11.3 | 17.1
| | S/N(c) | 4.9 | 9.9 | 16.1
| | SN(E/C) 0.60
|
| 
| 
| 
| 
| 
|
| 7900038
| 47
| | Red | Green | Blue
| | z | | 18.07
| | znorm | | 13.89
| | sky | 15.1 | 14.8 | 14.9
| | S/N | 6.8 | 12.6 | 17.7
| | S/N(c) | 6.0 | 11.1 | 16.8
| | SN(E/C) 0.52
|
| 
| 
| 
| 
| 
|
| 7900039
| 47
| | Red | Green | Blue
| | z | | 18.27
| | znorm | | 14.09
| | sky | 15.0 | 14.7 | 15.0
| | S/N | 7.8 | 13.9 | 18.8
| | S/N(c) | 6.8 | 12.9 | 17.8
| | SN(E/C) 0.51
|
| 
| 
| 
| 
| 
|
| 7900040
| 47
| | Red | Green | Blue
| | z | | 18.22
| | znorm | | 14.04
| | sky | 15.2 | 14.8 | 14.9
| | S/N | 7.9 | 13.8 | 18.3
| | S/N(c) | 6.8 | 12.6 | 17.5
| | SN(E/C) 0.49
|
| 
| 
| 
| 
| 
|
| 7900041
| 47
| | Red | Green | Blue
| | z | | 18.52
| | znorm | | 14.34
| | sky | 15.0 | 14.8 | 14.9
| | S/N | 9.7 | 16.5 | 20.9
| | S/N(c) | 8.7 | 15.5 | 19.9
| | SN(E/C) 0.48
|
| 
| 
| 
| 
| 
|
| 7900042
| 47
| | Red | Green | Blue
| | z | | 18.73
| | znorm | | 14.55
| | sky | 15.4 | 15.0 | 15.0
| | S/N | 11.1 | 18.3 | 22.2
| | S/N(c) | 9.9 | 17.3 | 21.5
| | SN(E/C) 0.37
|
| 
| 
| 
| 
| 
|
| 7900043
| 47
| | Red | Green | Blue
| | z | | 18.73
| | znorm | | 14.55
| | sky | 15.4 | 15.3 | 14.9
| | S/N | 11.2 | 18.9 | 22.2
| | S/N(c) | 10.0 | 17.2 | 21.6
| | SN(E/C) 0.43
|
| 
| 
| 
| 
| 
|
| 7900044
| 47
| | Red | Green | Blue
| | z | | 18.73
| | znorm | | 14.55
| | sky | 15.3 | 15.2 | 15.0
| | S/N | 11.2 | 19.0 | 22.3
| | S/N(c) | 9.9 | 17.4 | 21.6
| | SN(E/C) 0.43
|
| 
| 
| 
| 
| 
|