| Red | Green | Blue | |
| z | 17.64 | ||
| znorm | Inf | ||
| sky | -NaN | -Inf | -Inf |
| S/N | 16.0 | 29.3 | 38.6 |
| S/N(c) | 0.0 | 0.0 | 0.0 |
| SN(E/C) |
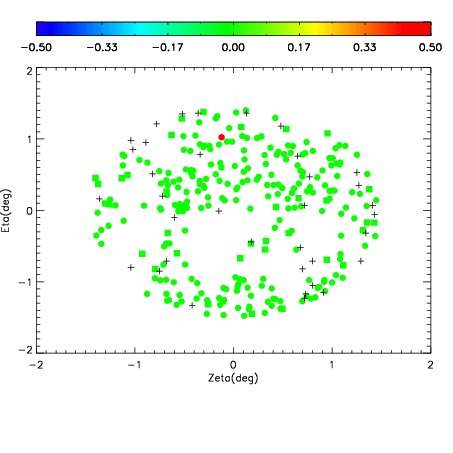

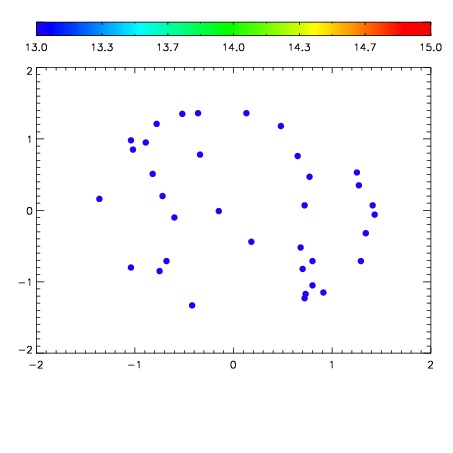

| Frame | Nreads | Zeropoints | Mag plots | Spatial mag deviation | Spatial sky 16325A emission deviations (filled: sky, open: star) | Spatial sky continuum emission | Spatial sky telluric CO2 absorption deviations (filled: H < 10) | |||||||||||||||||||||||
| 0 | 0 |
|
|
|
|
|
|
| IPAIR | NAME | SHIFT | NEWSHIFT | S/N | NAME | SHIFT | NEWSHIFT | S/N |
| 0 | 07900043 | 0.469351 | 0.00000 | 183.312 | 07900044 | 0.00334353 | 0.466007 | 184.890 |
| 1 | 07900042 | 0.468164 | 0.00118700 | 180.450 | 07900041 | 0.00173581 | 0.467615 | 163.311 |
| 2 | 07900039 | 0.469073 | 0.000277996 | 143.849 | 07900040 | 0.00101238 | 0.468339 | 141.561 |
| 3 | 07900038 | 0.466579 | 0.00277200 | 129.826 | 07900037 | 0.00000 | 0.469351 | 117.751 |