| Red | Green | Blue | |
| z | 17.64 | ||
| znorm | Inf | ||
| sky | -Inf | -Inf | -Inf |
| S/N | 25.3 | 43.7 | 53.0 |
| S/N(c) | 0.0 | 0.0 | 0.0 |
| SN(E/C) |
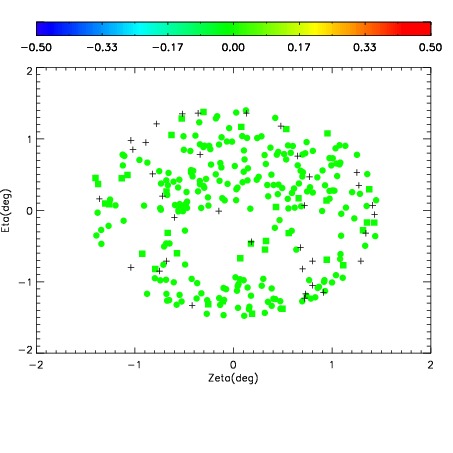
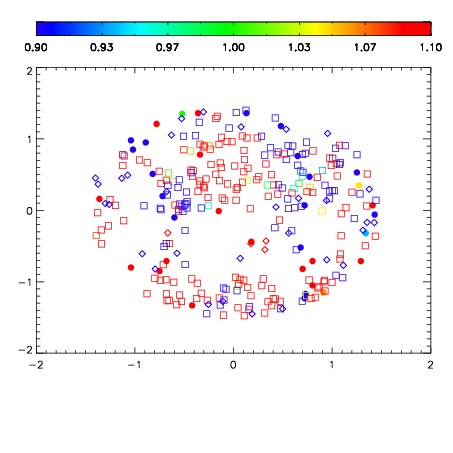
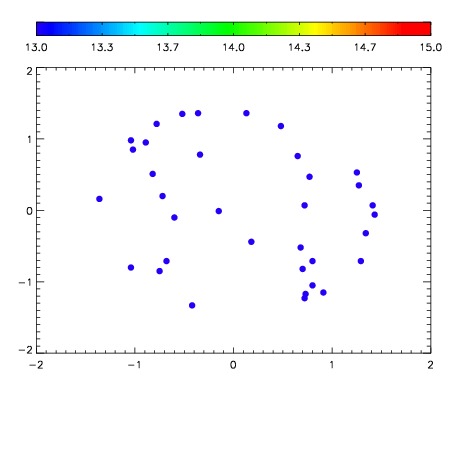

| Frame | Nreads | Zeropoints | Mag plots | Spatial mag deviation | Spatial sky 16325A emission deviations (filled: sky, open: star) | Spatial sky continuum emission | Spatial sky telluric CO2 absorption deviations (filled: H < 10) | |||||||||||||||||||||||
| 0 | 0 |
|
|
|
|
|
|
| IPAIR | NAME | SHIFT | NEWSHIFT | S/N | NAME | SHIFT | NEWSHIFT | S/N |
| 0 | 08190031 | 0.512906 | 0.00000 | 220.055 | 08190025 | 0.00000 | 0.512906 | 219.107 |
| 1 | 08190026 | 0.507849 | 0.00505704 | 211.654 | 08190032 | 0.00448509 | 0.508421 | 216.242 |
| 2 | 08190027 | 0.512581 | 0.000325024 | 199.178 | 08190028 | 0.00326653 | 0.509640 | 197.191 |
| 3 | 08190030 | 0.510850 | 0.00205600 | 192.154 | 08190029 | 0.00196635 | 0.510940 | 177.989 |