| Red | Green | Blue | |
| z | 17.64 | ||
| znorm | Inf | ||
| sky | -Inf | -Inf | -Inf |
| S/N | 28.5 | 46.2 | 50.3 |
| S/N(c) | 0.0 | 0.0 | 0.0 |
| SN(E/C) |
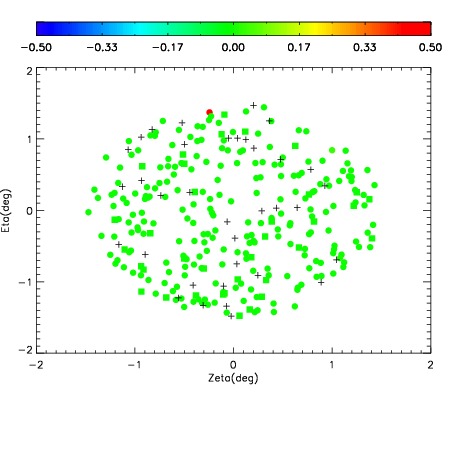
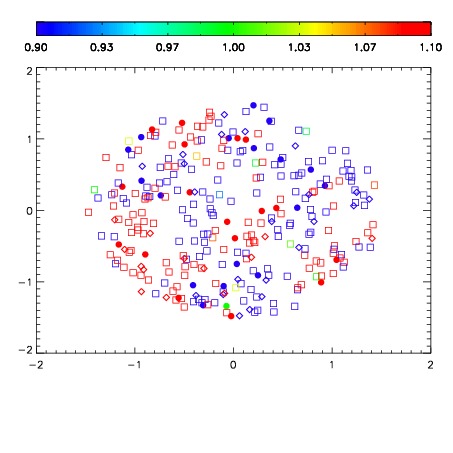
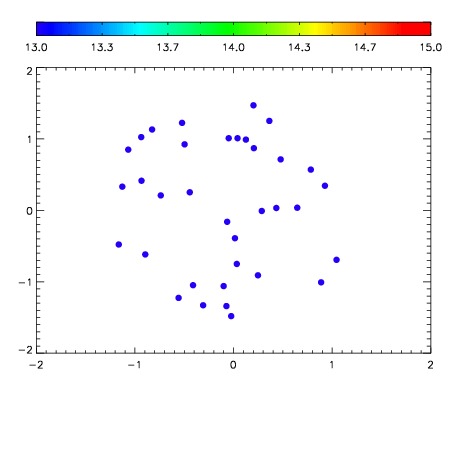

| Frame | Nreads | Zeropoints | Mag plots | Spatial mag deviation | Spatial sky 16325A emission deviations (filled: sky, open: star) | Spatial sky continuum emission | Spatial sky telluric CO2 absorption deviations (filled: H < 10) | |||||||||||||||||||||||
| 0 | 0 |
|
|
|
|
|
|
| IPAIR | NAME | SHIFT | NEWSHIFT | S/N | NAME | SHIFT | NEWSHIFT | S/N |
| 0 | 03650017 | 0.510912 | 0.00000 | 185.612 | 03650019 | 0.000771220 | 0.510141 | 188.769 |
| 1 | 03650020 | 0.509796 | 0.00111598 | 190.100 | 03650022 | 0.00407169 | 0.506840 | 193.459 |
| 2 | 03650021 | 0.509420 | 0.00149202 | 189.227 | 03650018 | 0.00104969 | 0.509862 | 190.109 |
| 3 | 03650016 | 0.508171 | 0.00274098 | 181.310 | 03650015 | 0.00000 | 0.510912 | 174.887 |