| Red | Green | Blue | |
| z | 17.64 | ||
| znorm | Inf | ||
| sky | -Inf | -Inf | -Inf |
| S/N | 24.9 | 41.0 | 44.5 |
| S/N(c) | 0.0 | 0.0 | 0.0 |
| SN(E/C) |
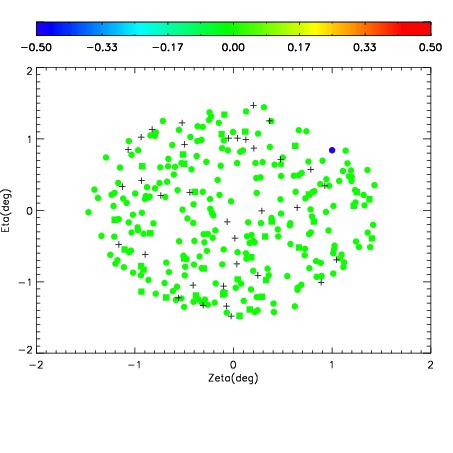
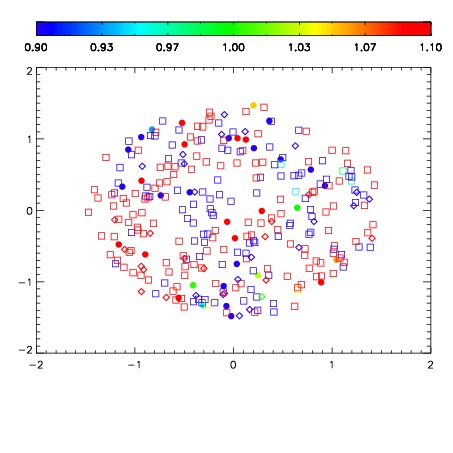
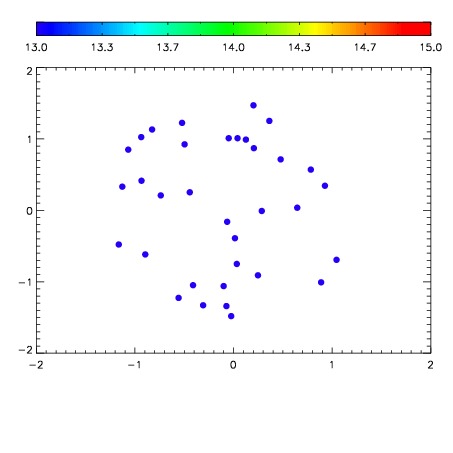

| Frame | Nreads | Zeropoints | Mag plots | Spatial mag deviation | Spatial sky 16325A emission deviations (filled: sky, open: star) | Spatial sky continuum emission | Spatial sky telluric CO2 absorption deviations (filled: H < 10) | |||||||||||||||||||||||
| 0 | 0 |
|
|
|
|
|
|
| IPAIR | NAME | SHIFT | NEWSHIFT | S/N | NAME | SHIFT | NEWSHIFT | S/N |
| 0 | 03690014 | 0.502018 | 0.00000 | 179.032 | 03690015 | 0.00388076 | 0.498137 | 175.582 |
| 1 | 03690013 | 0.498720 | 0.00329798 | 176.365 | 03690012 | 0.00287960 | 0.499138 | 174.198 |
| 2 | 03690010 | 0.498568 | 0.00344998 | 161.703 | 03690011 | 0.00467392 | 0.497344 | 166.496 |
| 3 | 03690009 | 0.497731 | 0.00428697 | 158.229 | 03690008 | 0.00000 | 0.502018 | 165.372 |