| Red | Green | Blue | |
| z | 17.64 | ||
| znorm | Inf | ||
| sky | -Inf | -Inf | -Inf |
| S/N | 19.8 | 33.8 | 38.4 |
| S/N(c) | 0.0 | 0.0 | 0.0 |
| SN(E/C) |
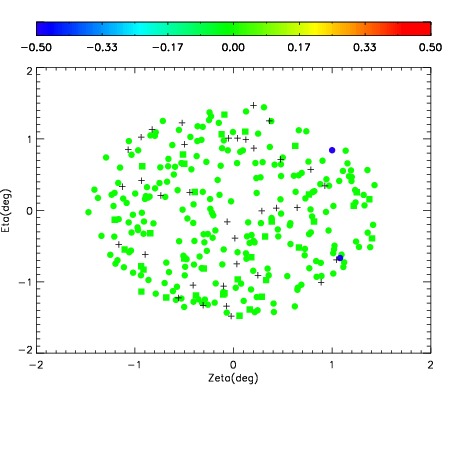
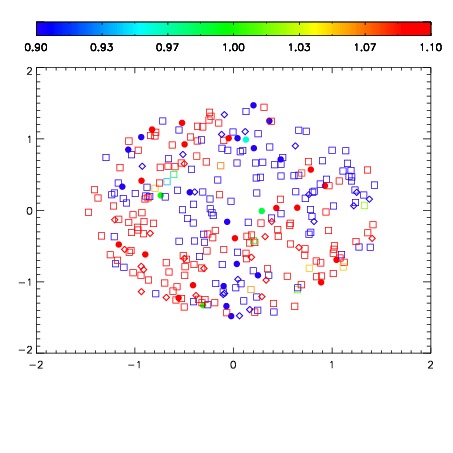


| Frame | Nreads | Zeropoints | Mag plots | Spatial mag deviation | Spatial sky 16325A emission deviations (filled: sky, open: star) | Spatial sky continuum emission | Spatial sky telluric CO2 absorption deviations (filled: H < 10) | |||||||||||||||||||||||
| 0 | 0 |
|
|
|
|
|
|
| IPAIR | NAME | SHIFT | NEWSHIFT | S/N | NAME | SHIFT | NEWSHIFT | S/N |
| 0 | 06720023 | 0.481228 | 0.00000 | 144.795 | 06720028 | -3.97346e-05 | 0.481268 | 142.064 |
| 1 | 06720027 | 0.480617 | 0.000611007 | 165.575 | 06720024 | -0.00202996 | 0.483258 | 166.396 |
| 2 | 06720026 | 0.478531 | 0.00269699 | 162.763 | 06720021 | 0.00000 | 0.481228 | 154.203 |
| 3 | 06720022 | 0.479114 | 0.00211400 | 124.040 | 06720025 | -0.00488595 | 0.486114 | 127.581 |