| Red | Green | Blue | |
| z | 17.64 | ||
| znorm | Inf | ||
| sky | -Inf | -Inf | -Inf |
| S/N | 19.4 | 35.6 | 37.5 |
| S/N(c) | 0.0 | 0.0 | 0.0 |
| SN(E/C) |
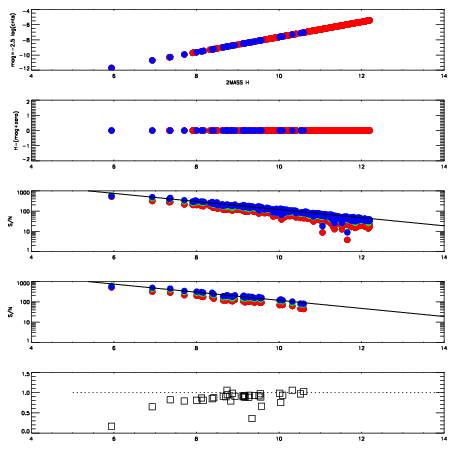
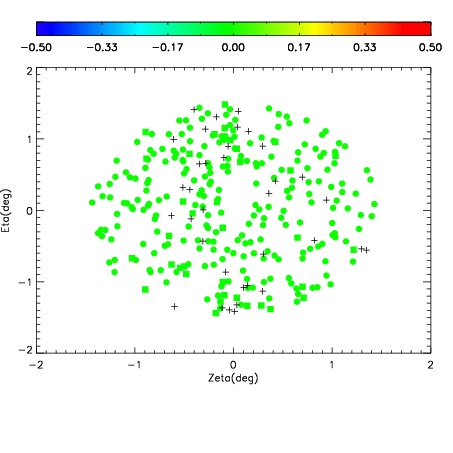
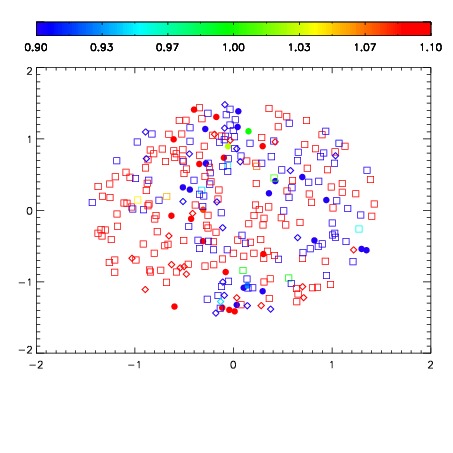
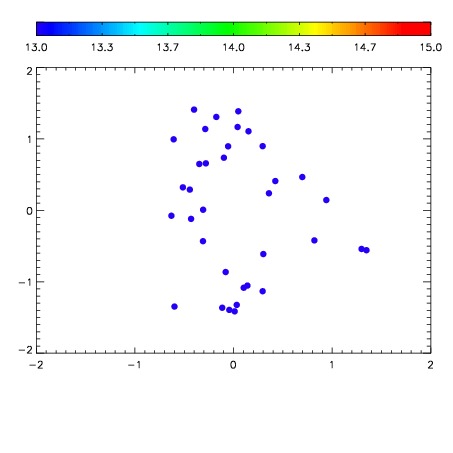

| Frame | Nreads | Zeropoints | Mag plots | Spatial mag deviation | Spatial sky 16325A emission deviations (filled: sky, open: star) | Spatial sky continuum emission | Spatial sky telluric CO2 absorption deviations (filled: H < 10) | |||||||||||||||||||||||
| 0 | 0 |
|
|
|
|
|
|
| IPAIR | NAME | SHIFT | NEWSHIFT | S/N | NAME | SHIFT | NEWSHIFT | S/N |
| 0 | 07290013 | 0.485275 | 0.00000 | 137.604 | 07290015 | 0.00243043 | 0.482845 | 134.674 |
| 1 | 07290017 | 0.485248 | 2.70009e-05 | 162.959 | 07290011 | 0.00000 | 0.485275 | 169.840 |
| 2 | 07290016 | 0.485079 | 0.000196010 | 160.252 | 07290018 | 0.00402172 | 0.481253 | 165.093 |
| 3 | 07290012 | 0.485226 | 4.89950e-05 | 143.940 | 07290014 | 0.00152853 | 0.483746 | 143.248 |