| Red | Green | Blue | |
| z | 17.64 | ||
| znorm | Inf | ||
| sky | -Inf | -Inf | -Inf |
| S/N | 32.4 | 52.7 | 57.3 |
| S/N(c) | 0.0 | 0.0 | 0.0 |
| SN(E/C) |
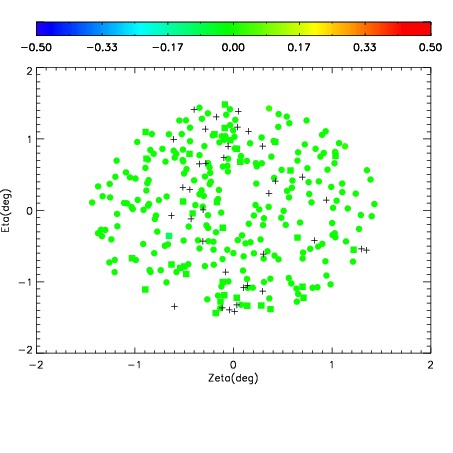
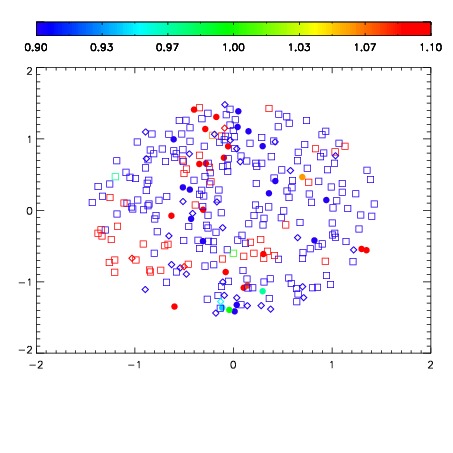
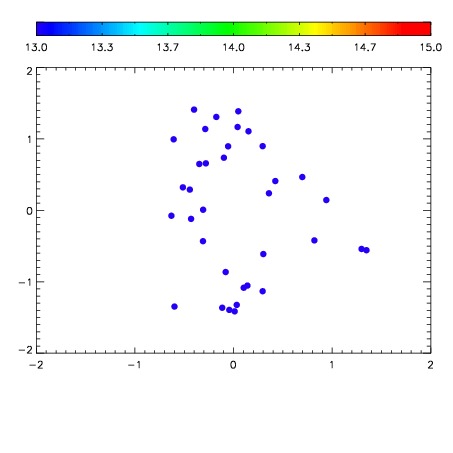

| Frame | Nreads | Zeropoints | Mag plots | Spatial mag deviation | Spatial sky 16325A emission deviations (filled: sky, open: star) | Spatial sky continuum emission | Spatial sky telluric CO2 absorption deviations (filled: H < 10) | |||||||||||||||||||||||
| 0 | 0 |
|
|
|
|
|
|
| IPAIR | NAME | SHIFT | NEWSHIFT | S/N | NAME | SHIFT | NEWSHIFT | S/N |
| 0 | 09720038 | 0.517961 | 0.00000 | 216.548 | 09720043 | 0.00449058 | 0.513470 | 218.706 |
| 1 | 09720037 | 0.516819 | 0.00114202 | 223.351 | 09720036 | 0.00000 | 0.517961 | 225.155 |
| 2 | 09720042 | 0.516201 | 0.00176001 | 222.975 | 09720039 | 0.00397157 | 0.513989 | 222.772 |
| 3 | 09720041 | 0.516664 | 0.00129700 | 221.811 | 09720040 | 0.00381921 | 0.514142 | 222.152 |