| Red | Green | Blue | |
| z | 17.64 | ||
| znorm | Inf | ||
| sky | -Inf | -Inf | -Inf |
| S/N | 23.3 | 39.7 | 46.1 |
| S/N(c) | 0.0 | 0.0 | 0.0 |
| SN(E/C) |
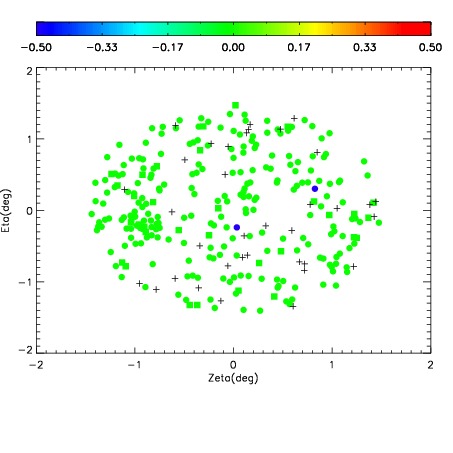
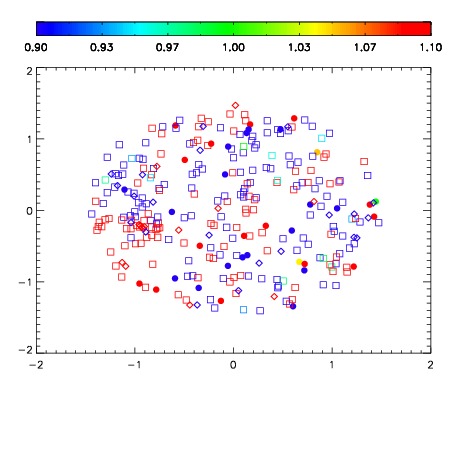
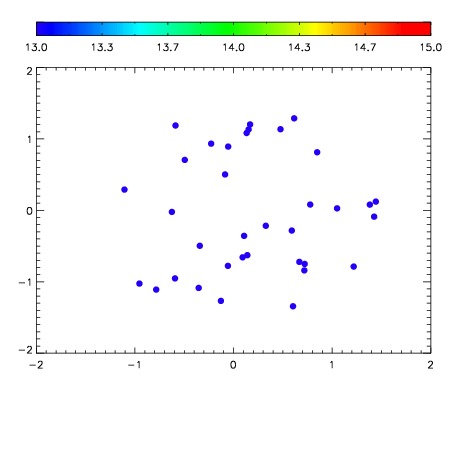

| Frame | Nreads | Zeropoints | Mag plots | Spatial mag deviation | Spatial sky 16325A emission deviations (filled: sky, open: star) | Spatial sky continuum emission | Spatial sky telluric CO2 absorption deviations (filled: H < 10) | |||||||||||||||||||||||
| 0 | 0 |
|
|
|
|
|
|
| IPAIR | NAME | SHIFT | NEWSHIFT | S/N | NAME | SHIFT | NEWSHIFT | S/N |
| 0 | 06980032 | 0.483323 | 0.00000 | 161.239 | 06980029 | 0.00345173 | 0.479871 | 174.254 |
| 1 | 06980027 | 0.481036 | 0.00228700 | 206.166 | 06980026 | 0.00000 | 0.483323 | 197.531 |
| 2 | 06980028 | 0.482016 | 0.00130701 | 190.142 | 06980033 | 0.00283685 | 0.480486 | 194.476 |
| 3 | 06980031 | 0.482249 | 0.00107402 | 167.369 | 06980030 | 0.00230139 | 0.481022 | 177.028 |