| Red | Green | Blue | |
| z | 17.64 | ||
| znorm | Inf | ||
| sky | -Inf | -Inf | -Inf |
| S/N | 19.4 | 34.5 | 36.2 |
| S/N(c) | 0.0 | 0.0 | 0.0 |
| SN(E/C) |
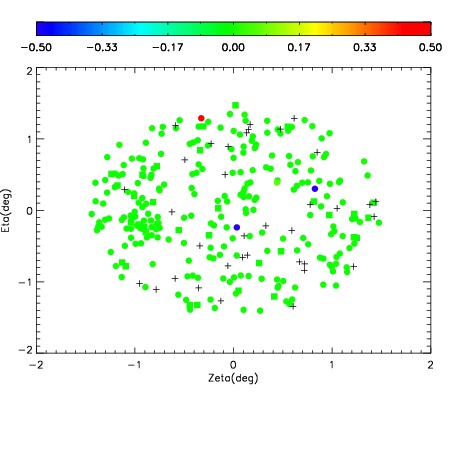
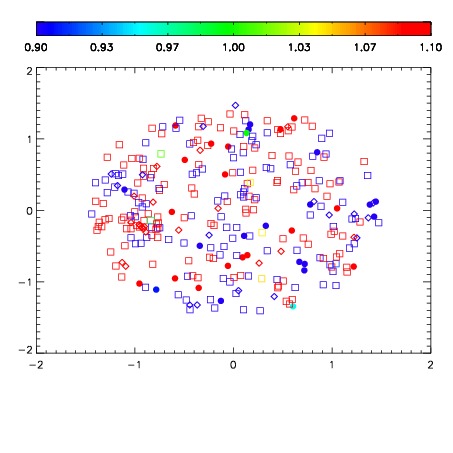
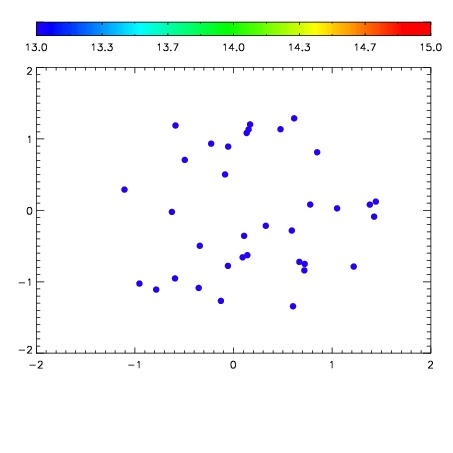

| Frame | Nreads | Zeropoints | Mag plots | Spatial mag deviation | Spatial sky 16325A emission deviations (filled: sky, open: star) | Spatial sky continuum emission | Spatial sky telluric CO2 absorption deviations (filled: H < 10) | |||||||||||||||||||||||
| 0 | 0 |
|
|
|
|
|
|
| IPAIR | NAME | SHIFT | NEWSHIFT | S/N | NAME | SHIFT | NEWSHIFT | S/N |
| 0 | 07210017 | 0.486367 | 0.00000 | 184.107 | 07210018 | 0.00553377 | 0.480833 | 180.484 |
| 1 | 07210016 | 0.485838 | 0.000528991 | 181.530 | 07210015 | 0.00628641 | 0.480081 | 170.848 |
| 2 | 07210013 | 0.484318 | 0.00204900 | 168.599 | 07210014 | 0.00710389 | 0.479263 | 160.638 |
| 3 | 07210012 | 0.483782 | 0.00258499 | 135.800 | 07210011 | 0.00000 | 0.486367 | 109.688 |