| Red | Green | Blue | |
| z | 17.64 | ||
| znorm | Inf | ||
| sky | -Inf | -Inf | -Inf |
| S/N | 13.7 | 24.9 | 26.7 |
| S/N(c) | 0.0 | 0.0 | 0.0 |
| SN(E/C) |
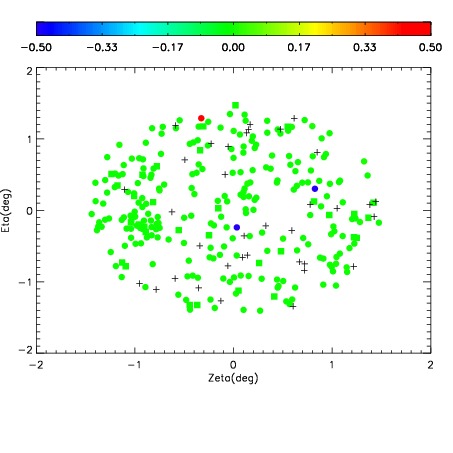

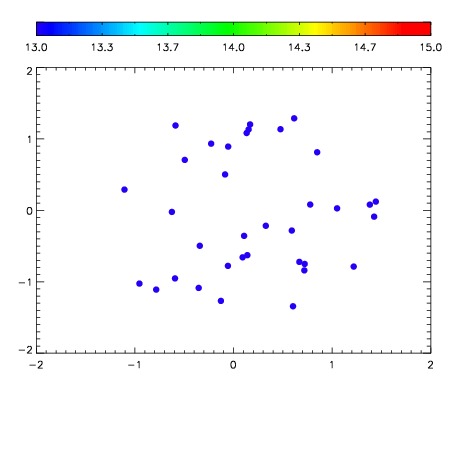

| Frame | Nreads | Zeropoints | Mag plots | Spatial mag deviation | Spatial sky 16325A emission deviations (filled: sky, open: star) | Spatial sky continuum emission | Spatial sky telluric CO2 absorption deviations (filled: H < 10) | |||||||||||||||||||||||
| 0 | 0 |
|
|
|
|
|
|
| IPAIR | NAME | SHIFT | NEWSHIFT | S/N | NAME | SHIFT | NEWSHIFT | S/N |
| 0 | 07260018 | 0.481825 | 0.00000 | 107.273 | 07260016 | 0.00195503 | 0.479870 | 118.219 |
| 1 | 07260017 | 0.481484 | 0.000340998 | 113.122 | 07260012 | 0.00000 | 0.481825 | 136.839 |
| 2 | 07260013 | 0.477486 | 0.00433898 | 86.7797 | 07260015 | 0.00267496 | 0.479150 | 100.882 |
| 3 | 07260014 | 0.477313 | 0.00451198 | 80.2937 | 07260019 | 0.00266206 | 0.479163 | 83.4285 |