| Red | Green | Blue | |
| z | 17.64 | ||
| znorm | Inf | ||
| sky | -Inf | -Inf | -Inf |
| S/N | 24.2 | 43.3 | 45.8 |
| S/N(c) | 0.0 | 0.0 | 0.0 |
| SN(E/C) |
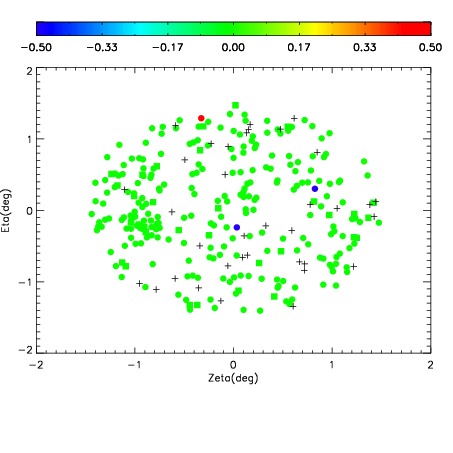
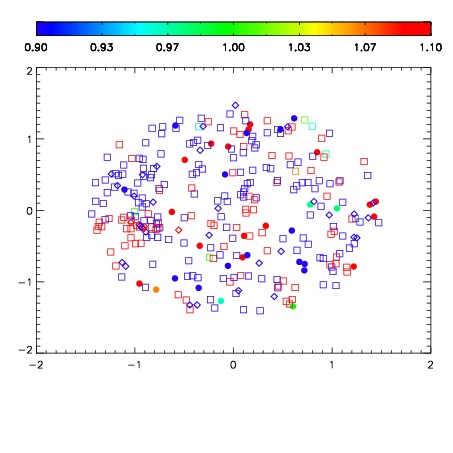
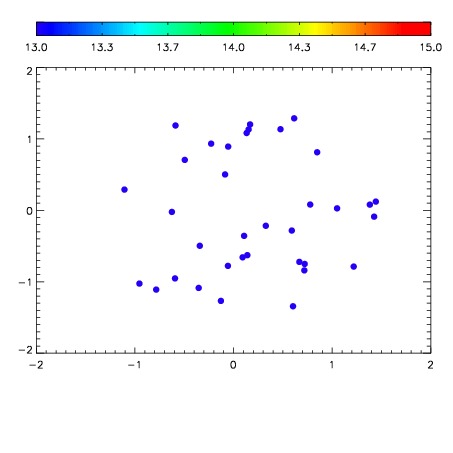

| Frame | Nreads | Zeropoints | Mag plots | Spatial mag deviation | Spatial sky 16325A emission deviations (filled: sky, open: star) | Spatial sky continuum emission | Spatial sky telluric CO2 absorption deviations (filled: H < 10) | |||||||||||||||||||||||
| 0 | 0 |
|
|
|
|
|
|
| IPAIR | NAME | SHIFT | NEWSHIFT | S/N | NAME | SHIFT | NEWSHIFT | S/N |
| 0 | 07280013 | 0.485649 | 0.00000 | 155.399 | 07280011 | 0.00000 | 0.485649 | 155.783 |
| 1 | 07280017 | 0.484120 | 0.00152898 | 159.976 | 07280018 | 0.000513861 | 0.485135 | 161.189 |
| 2 | 07280012 | 0.485322 | 0.000326991 | 158.841 | 07280015 | 9.99644e-05 | 0.485549 | 157.257 |
| 3 | 07280016 | 0.483100 | 0.00254899 | 157.756 | 07280014 | 4.44257e-05 | 0.485605 | 157.070 |