| Red | Green | Blue | |
| z | 17.64 | ||
| znorm | Inf | ||
| sky | -Inf | -NaN | -NaN |
| S/N | 26.8 | 45.8 | 48.1 |
| S/N(c) | 0.0 | 0.0 | 0.0 |
| SN(E/C) |
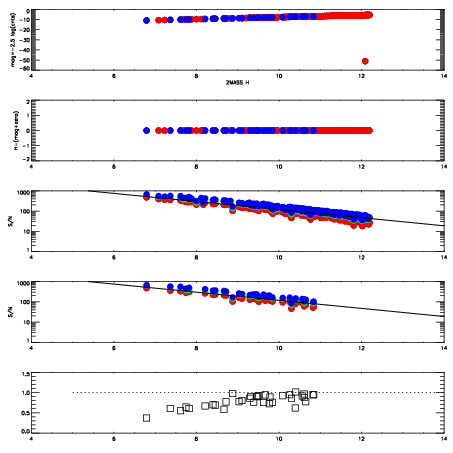


| Frame | Nreads | Zeropoints | Mag plots | Spatial mag deviation | Spatial sky 16325A emission deviations (filled: sky, open: star) | Spatial sky continuum emission | Spatial sky telluric CO2 absorption deviations (filled: H < 10) | |||||||||||||||||||||||
| 0 | 0 |
|
|
|
|
|
|
| IPAIR | NAME | SHIFT | NEWSHIFT | S/N | NAME | SHIFT | NEWSHIFT | S/N |
| 0 | 03710012 | 0.498052 | 0.00000 | 228.282 | 03710010 | 0.00000 | 0.498052 | 229.579 |
| 1 | 03710016 | 0.496516 | 0.00153601 | 234.146 | 03710017 | -0.00176968 | 0.499822 | 235.843 |
| 2 | 03710015 | 0.492696 | 0.00535601 | 231.539 | 03710013 | 0.000300327 | 0.497752 | 231.228 |
| 3 | 03710011 | 0.491373 | 0.00667900 | 229.417 | 03710014 | -0.00378981 | 0.501842 | 231.099 |