| Red | Green | Blue | |
| z | 17.64 | ||
| znorm | Inf | ||
| sky | -Inf | -Inf | -Inf |
| S/N | 24.9 | 44.4 | 50.6 |
| S/N(c) | 0.0 | 0.0 | 0.0 |
| SN(E/C) |
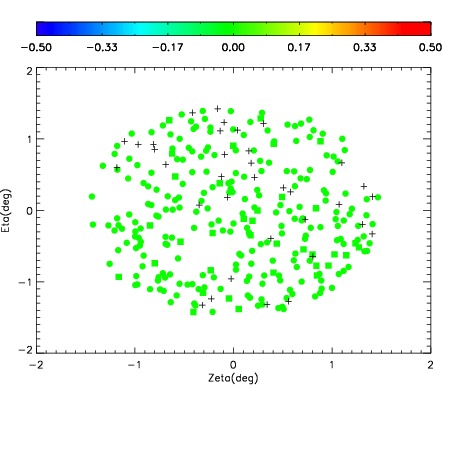
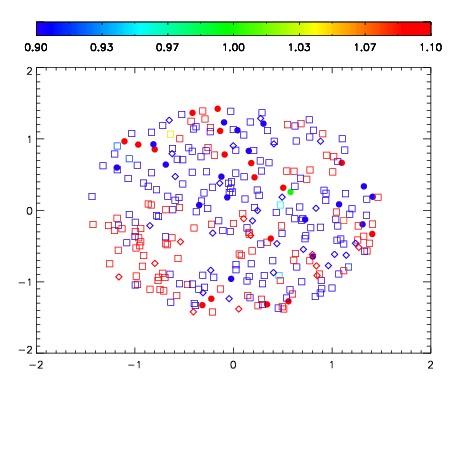
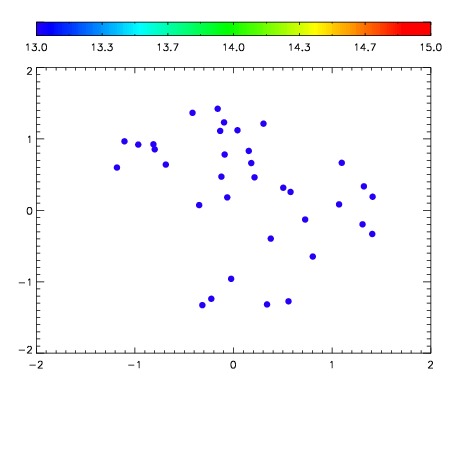

| Frame | Nreads | Zeropoints | Mag plots | Spatial mag deviation | Spatial sky 16325A emission deviations (filled: sky, open: star) | Spatial sky continuum emission | Spatial sky telluric CO2 absorption deviations (filled: H < 10) | |||||||||||||||||||||||
| 0 | 0 |
|
|
|
|
|
|
| IPAIR | NAME | SHIFT | NEWSHIFT | S/N | NAME | SHIFT | NEWSHIFT | S/N |
| 0 | 09970068 | 0.524679 | 0.00000 | 215.072 | 09970066 | 0.00000 | 0.524679 | 215.118 |
| 1 | 09970072 | 0.519043 | 0.00563598 | 218.888 | 09970069 | 0.000368258 | 0.524311 | 219.092 |
| 2 | 09970071 | 0.519466 | 0.00521302 | 215.638 | 09970070 | -0.000685843 | 0.525365 | 218.334 |
| 3 | 09970067 | 0.524602 | 7.70092e-05 | 214.868 | 09970073 | -0.00178972 | 0.526469 | 210.875 |