| Red | Green | Blue | |
| z | 17.64 | ||
| znorm | Inf | ||
| sky | -NaN | -NaN | -Inf |
| S/N | 27.1 | 47.4 | 51.4 |
| S/N(c) | 0.0 | 0.0 | 0.0 |
| SN(E/C) |

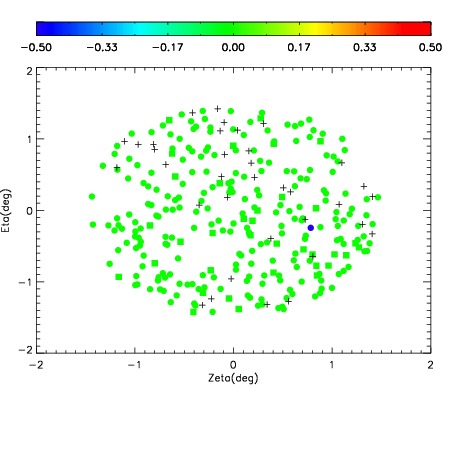
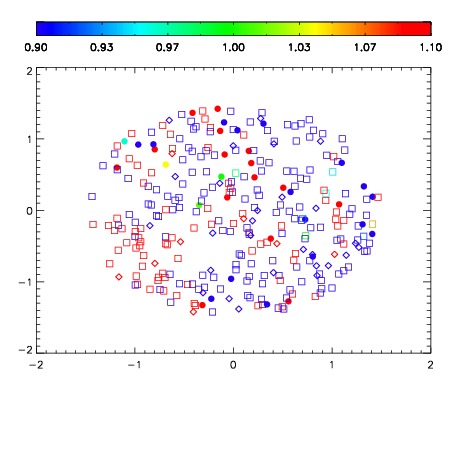
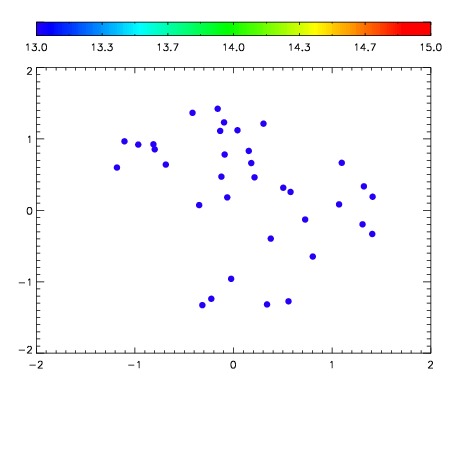

| Frame | Nreads | Zeropoints | Mag plots | Spatial mag deviation | Spatial sky 16325A emission deviations (filled: sky, open: star) | Spatial sky continuum emission | Spatial sky telluric CO2 absorption deviations (filled: H < 10) | |||||||||||||||||||||||
| 0 | 0 |
|
|
|
|
|
|
| IPAIR | NAME | SHIFT | NEWSHIFT | S/N | NAME | SHIFT | NEWSHIFT | S/N |
| 0 | 10200064 | 0.494254 | 0.00000 | 226.283 | 10200066 | 4.86209e-06 | 0.494249 | 224.234 |
| 1 | 10200065 | 0.492916 | 0.00133801 | 225.936 | 10200063 | 0.000901118 | 0.493353 | 223.913 |
| 2 | 10200061 | 0.493782 | 0.000471979 | 225.365 | 10200062 | 0.00198781 | 0.492266 | 223.156 |
| 3 | 10200060 | 0.494048 | 0.000205994 | 224.289 | 10200059 | 0.00000 | 0.494254 | 218.478 |