| Red | Green | Blue | |
| z | 17.64 | ||
| znorm | Inf | ||
| sky | -Inf | -Inf | -Inf |
| S/N | 26.1 | 44.8 | 47.6 |
| S/N(c) | 0.0 | 0.0 | 0.0 |
| SN(E/C) |


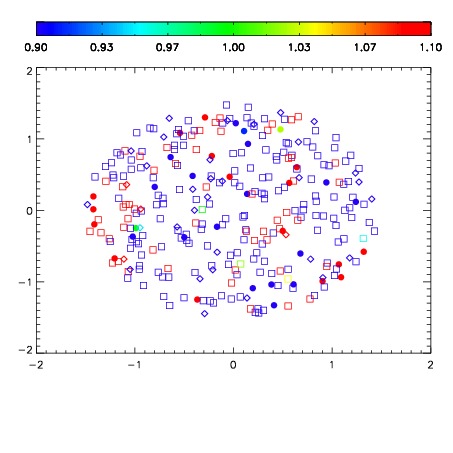
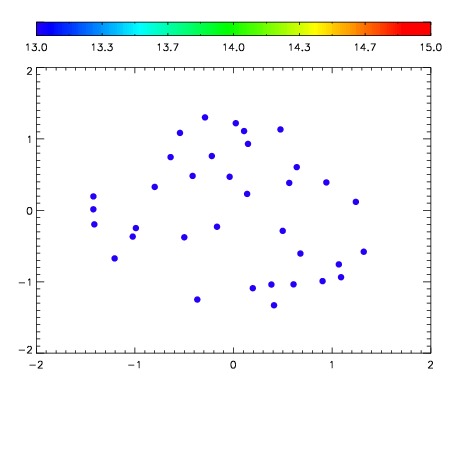

| Frame | Nreads | Zeropoints | Mag plots | Spatial mag deviation | Spatial sky 16325A emission deviations (filled: sky, open: star) | Spatial sky continuum emission | Spatial sky telluric CO2 absorption deviations (filled: H < 10) | |||||||||||||||||||||||
| 0 | 0 |
|
|
|
|
|
|
| IPAIR | NAME | SHIFT | NEWSHIFT | S/N | NAME | SHIFT | NEWSHIFT | S/N |
| 0 | 03700010 | 0.496194 | 0.00000 | 181.340 | 03700008 | 0.00000 | 0.496194 | 178.483 |
| 1 | 03700014 | 0.493646 | 0.00254801 | 190.597 | 03700015 | -0.000504189 | 0.496698 | 193.267 |
| 2 | 03700013 | 0.492668 | 0.00352600 | 186.489 | 03700012 | 0.000738616 | 0.495455 | 184.425 |
| 3 | 03700009 | 0.492982 | 0.00321200 | 180.175 | 03700011 | 0.00173479 | 0.494459 | 172.782 |