| Red | Green | Blue | |
| z | 17.64 | ||
| znorm | Inf | ||
| sky | -Inf | -Inf | -Inf |
| S/N | 29.6 | 47.9 | 52.7 |
| S/N(c) | 0.0 | 0.0 | 0.0 |
| SN(E/C) |
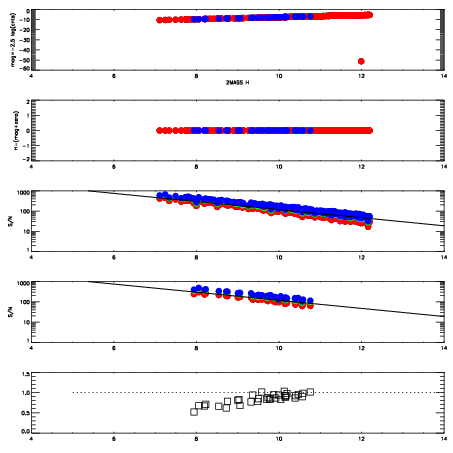
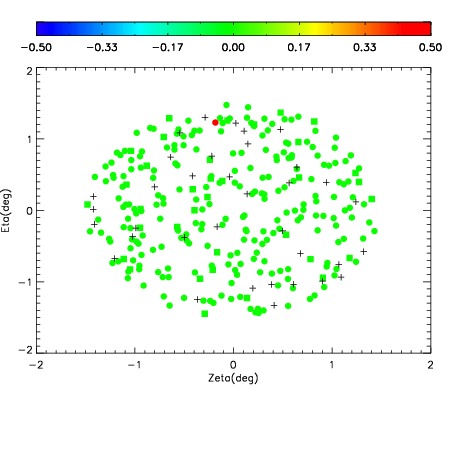
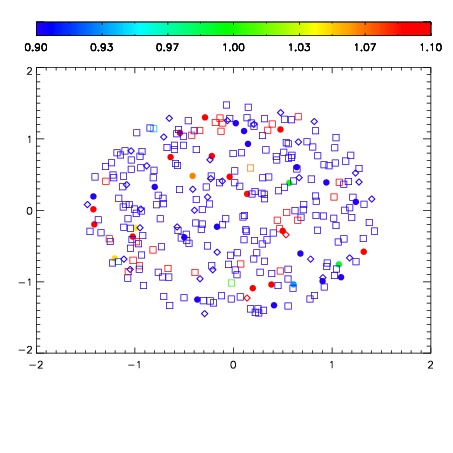
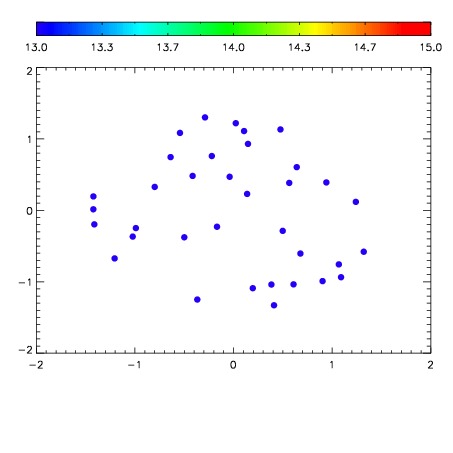

| Frame | Nreads | Zeropoints | Mag plots | Spatial mag deviation | Spatial sky 16325A emission deviations (filled: sky, open: star) | Spatial sky continuum emission | Spatial sky telluric CO2 absorption deviations (filled: H < 10) | |||||||||||||||||||||||
| 0 | 0 |
|
|
|
|
|
|
| IPAIR | NAME | SHIFT | NEWSHIFT | S/N | NAME | SHIFT | NEWSHIFT | S/N |
| 0 | 06730017 | 0.483921 | 0.00000 | 202.656 | 06730015 | 0.00160449 | 0.482316 | 201.969 |
| 1 | 06730013 | 0.483695 | 0.000225991 | 208.640 | 06730014 | 0.000748688 | 0.483172 | 204.466 |
| 2 | 06730012 | 0.481944 | 0.00197700 | 203.240 | 06730018 | -0.00495404 | 0.488875 | 204.370 |
| 3 | 06730016 | 0.481169 | 0.00275201 | 201.321 | 06730011 | 0.00000 | 0.483921 | 198.402 |