| Red | Green | Blue | |
| z | 17.64 | ||
| znorm | Inf | ||
| sky | -Inf | -Inf | -Inf |
| S/N | 26.5 | 46.5 | 49.7 |
| S/N(c) | 0.0 | 0.0 | 0.0 |
| SN(E/C) |
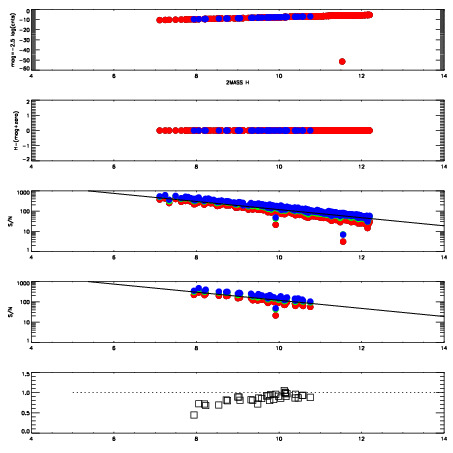
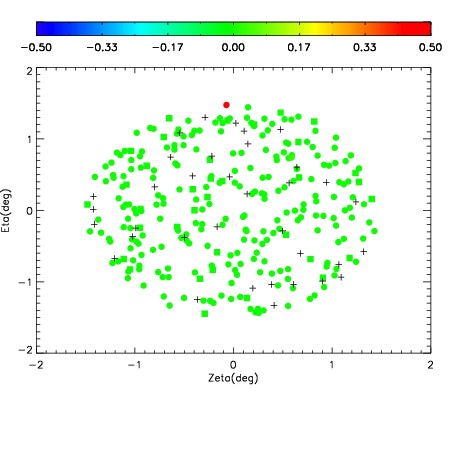
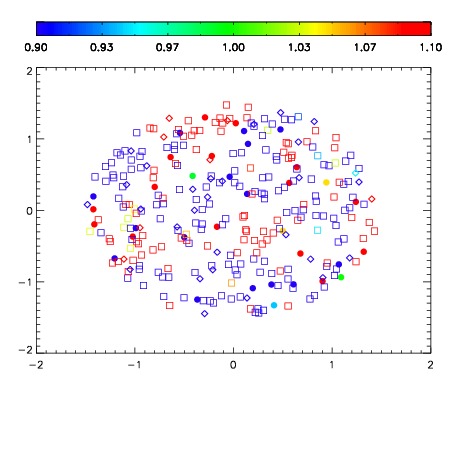
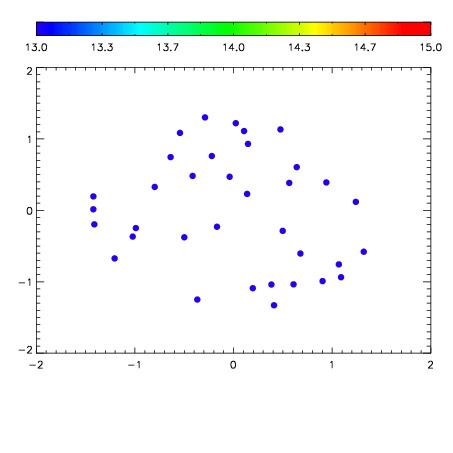

| Frame | Nreads | Zeropoints | Mag plots | Spatial mag deviation | Spatial sky 16325A emission deviations (filled: sky, open: star) | Spatial sky continuum emission | Spatial sky telluric CO2 absorption deviations (filled: H < 10) | |||||||||||||||||||||||
| 0 | 0 |
|
|
|
|
|
|
| IPAIR | NAME | SHIFT | NEWSHIFT | S/N | NAME | SHIFT | NEWSHIFT | S/N |
| 0 | 06970032 | 0.488694 | 0.00000 | 206.745 | 06970030 | -0.00104845 | 0.489742 | 205.479 |
| 1 | 06970031 | 0.488250 | 0.000444025 | 204.619 | 06970033 | 0.00186284 | 0.486831 | 202.025 |
| 2 | 06970028 | 0.486209 | 0.00248501 | 200.845 | 06970029 | 0.00133289 | 0.487361 | 199.412 |
| 3 | 06970027 | 0.485361 | 0.00333300 | 198.594 | 06970026 | 0.00000 | 0.488694 | 193.743 |