| Red | Green | Blue | |
| z | 17.64 | ||
| znorm | Inf | ||
| sky | -Inf | -Inf | -Inf |
| S/N | 27.6 | 45.5 | 46.1 |
| S/N(c) | 0.0 | 0.0 | 0.0 |
| SN(E/C) |

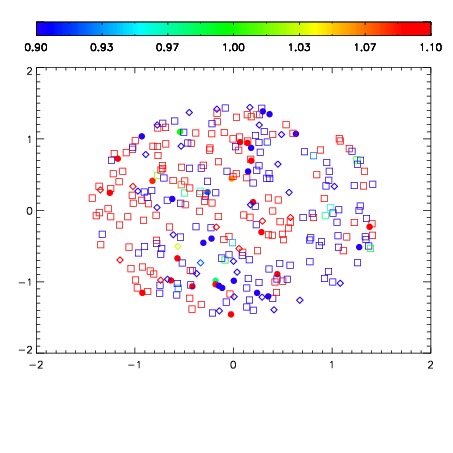
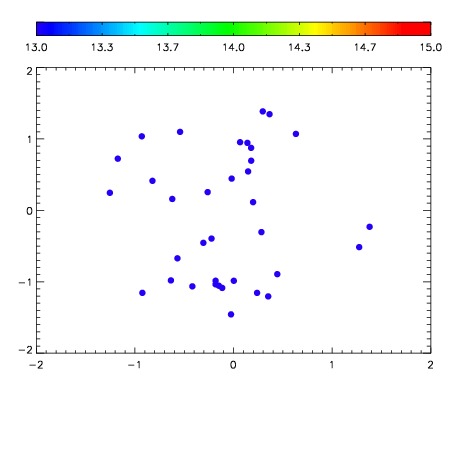

| Frame | Nreads | Zeropoints | Mag plots | Spatial mag deviation | Spatial sky 16325A emission deviations (filled: sky, open: star) | Spatial sky continuum emission | Spatial sky telluric CO2 absorption deviations (filled: H < 10) | |||||||||||||||||||||||
| 0 | 0 |
|
|
|
|
|
|
| IPAIR | NAME | SHIFT | NEWSHIFT | S/N | NAME | SHIFT | NEWSHIFT | S/N |
| 0 | 03640012 | 0.511902 | 0.00000 | 200.428 | 03640014 | 0.000607001 | 0.511295 | 197.909 |
| 1 | 03640016 | 0.509940 | 0.00196195 | 201.172 | 03640017 | 0.00160272 | 0.510299 | 204.802 |
| 2 | 03640015 | 0.508532 | 0.00336999 | 200.940 | 03640010 | 0.00000 | 0.511902 | 203.372 |
| 3 | 03640011 | 0.509871 | 0.00203097 | 196.305 | 03640013 | 0.00206560 | 0.509836 | 195.905 |