| Red | Green | Blue | |
| z | 17.64 | ||
| znorm | Inf | ||
| sky | -Inf | -Inf | -Inf |
| S/N | 23.6 | 39.6 | 40.7 |
| S/N(c) | 0.0 | 0.0 | 0.0 |
| SN(E/C) |
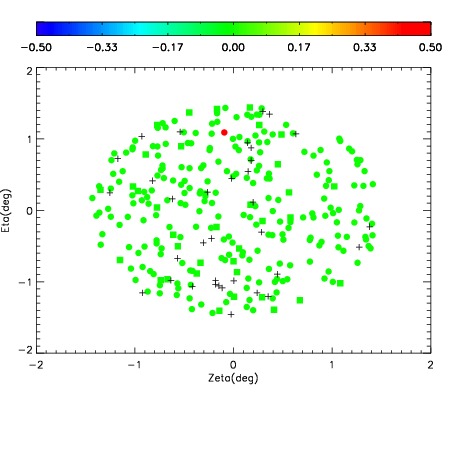
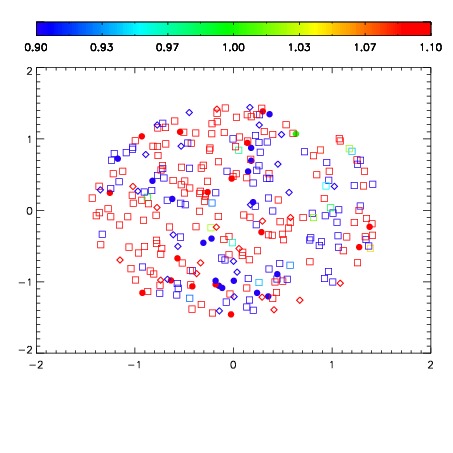
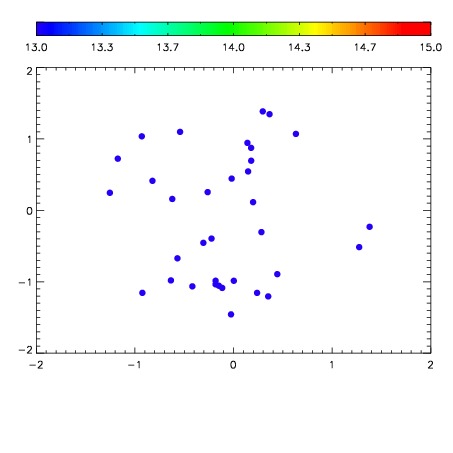

| Frame | Nreads | Zeropoints | Mag plots | Spatial mag deviation | Spatial sky 16325A emission deviations (filled: sky, open: star) | Spatial sky continuum emission | Spatial sky telluric CO2 absorption deviations (filled: H < 10) | |||||||||||||||||||||||
| 0 | 0 |
|
|
|
|
|
|
| IPAIR | NAME | SHIFT | NEWSHIFT | S/N | NAME | SHIFT | NEWSHIFT | S/N |
| 0 | 03680014 | 0.507254 | 0.00000 | 219.753 | 03680015 | 0.00297524 | 0.504279 | 219.133 |
| 1 | 03680013 | 0.507149 | 0.000105023 | 205.777 | 03680012 | 0.00323913 | 0.504015 | 205.619 |
| 2 | 03680009 | 0.502267 | 0.00498700 | 192.727 | 03680011 | 0.00204612 | 0.505208 | 190.649 |
| 3 | 03680010 | 0.504376 | 0.00287801 | 186.316 | 03680008 | 0.00000 | 0.507254 | 166.983 |