| Red | Green | Blue | |
| z | 17.64 | ||
| znorm | Inf | ||
| sky | -Inf | -Inf | -Inf |
| S/N | 32.9 | 54.9 | 58.7 |
| S/N(c) | 0.0 | 0.0 | 0.0 |
| SN(E/C) |
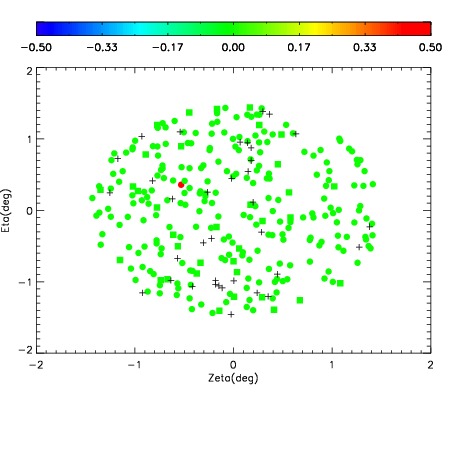
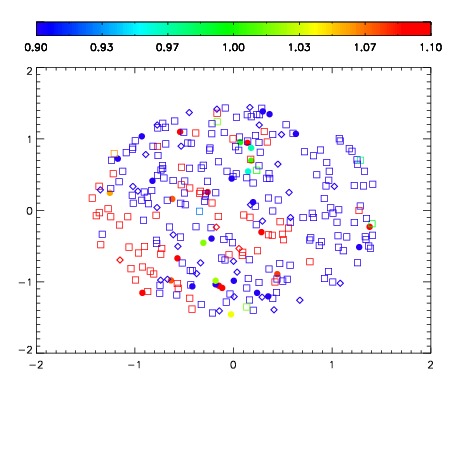
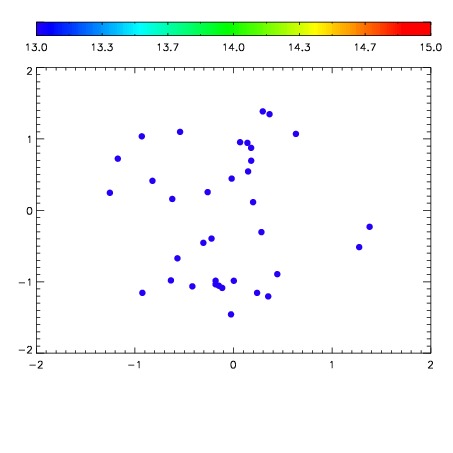

| Frame | Nreads | Zeropoints | Mag plots | Spatial mag deviation | Spatial sky 16325A emission deviations (filled: sky, open: star) | Spatial sky continuum emission | Spatial sky telluric CO2 absorption deviations (filled: H < 10) | |||||||||||||||||||||||
| 0 | 0 |
|
|
|
|
|
|
| IPAIR | NAME | SHIFT | NEWSHIFT | S/N | NAME | SHIFT | NEWSHIFT | S/N |
| 0 | 06070086 | 0.476865 | 0.00000 | 219.582 | 06070087 | -0.000582120 | 0.477447 | 217.713 |
| 1 | 06070089 | 0.474564 | 0.00230101 | 220.350 | 06070088 | -0.000673309 | 0.477538 | 219.546 |
| 2 | 06070085 | 0.476698 | 0.000166982 | 215.169 | 06070083 | -0.00193094 | 0.478796 | 212.483 |
| 3 | 06070081 | 0.474901 | 0.00196400 | 214.802 | 06070080 | 0.00000 | 0.476865 | 209.078 |
| 4 | 06070082 | 0.474615 | 0.00224999 | 210.606 | 06070084 | -0.000728830 | 0.477594 | 208.763 |