| Red | Green | Blue | |
| z | 17.64 | ||
| znorm | Inf | ||
| sky | -Inf | -Inf | -Inf |
| S/N | 24.8 | 44.0 | 46.1 |
| S/N(c) | 0.0 | 0.0 | 0.0 |
| SN(E/C) |
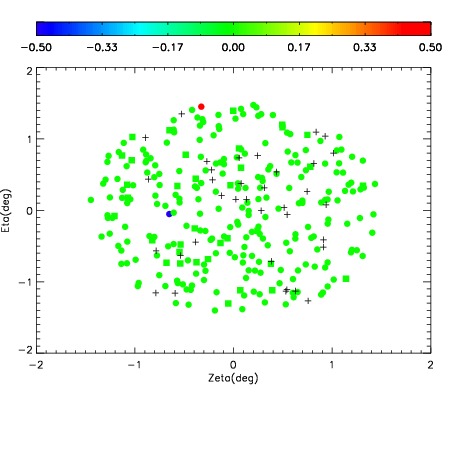
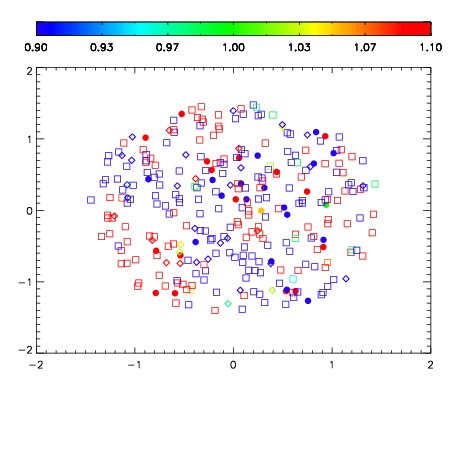
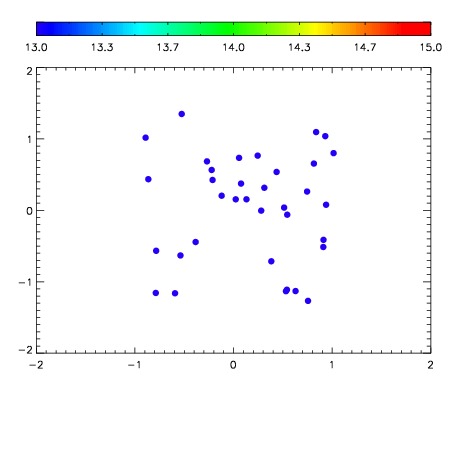

| Frame | Nreads | Zeropoints | Mag plots | Spatial mag deviation | Spatial sky 16325A emission deviations (filled: sky, open: star) | Spatial sky continuum emission | Spatial sky telluric CO2 absorption deviations (filled: H < 10) | |||||||||||||||||||||||
| 0 | 0 |
|
|
|
|
|
|
| IPAIR | NAME | SHIFT | NEWSHIFT | S/N | NAME | SHIFT | NEWSHIFT | S/N |
| 0 | 03720010 | 0.506870 | 0.00000 | 166.537 | 03720011 | 7.42226e-05 | 0.506796 | 164.797 |
| 1 | 03720014 | 0.503810 | 0.00305998 | 172.366 | 03720012 | -0.00172683 | 0.508597 | 170.494 |
| 2 | 03720013 | 0.502695 | 0.00417495 | 168.780 | 03720015 | 0.00237304 | 0.504497 | 170.314 |
| 3 | 03720009 | 0.501069 | 0.00580096 | 166.098 | 03720008 | 0.00000 | 0.506870 | 159.304 |